29
/fr/
fr
AIzaSyAYiBZKx7MnpbEhh9jyipgxe19OcubqV5w
April 1, 2024
55940
Pre-demographic dividend
PRE
false
2
1
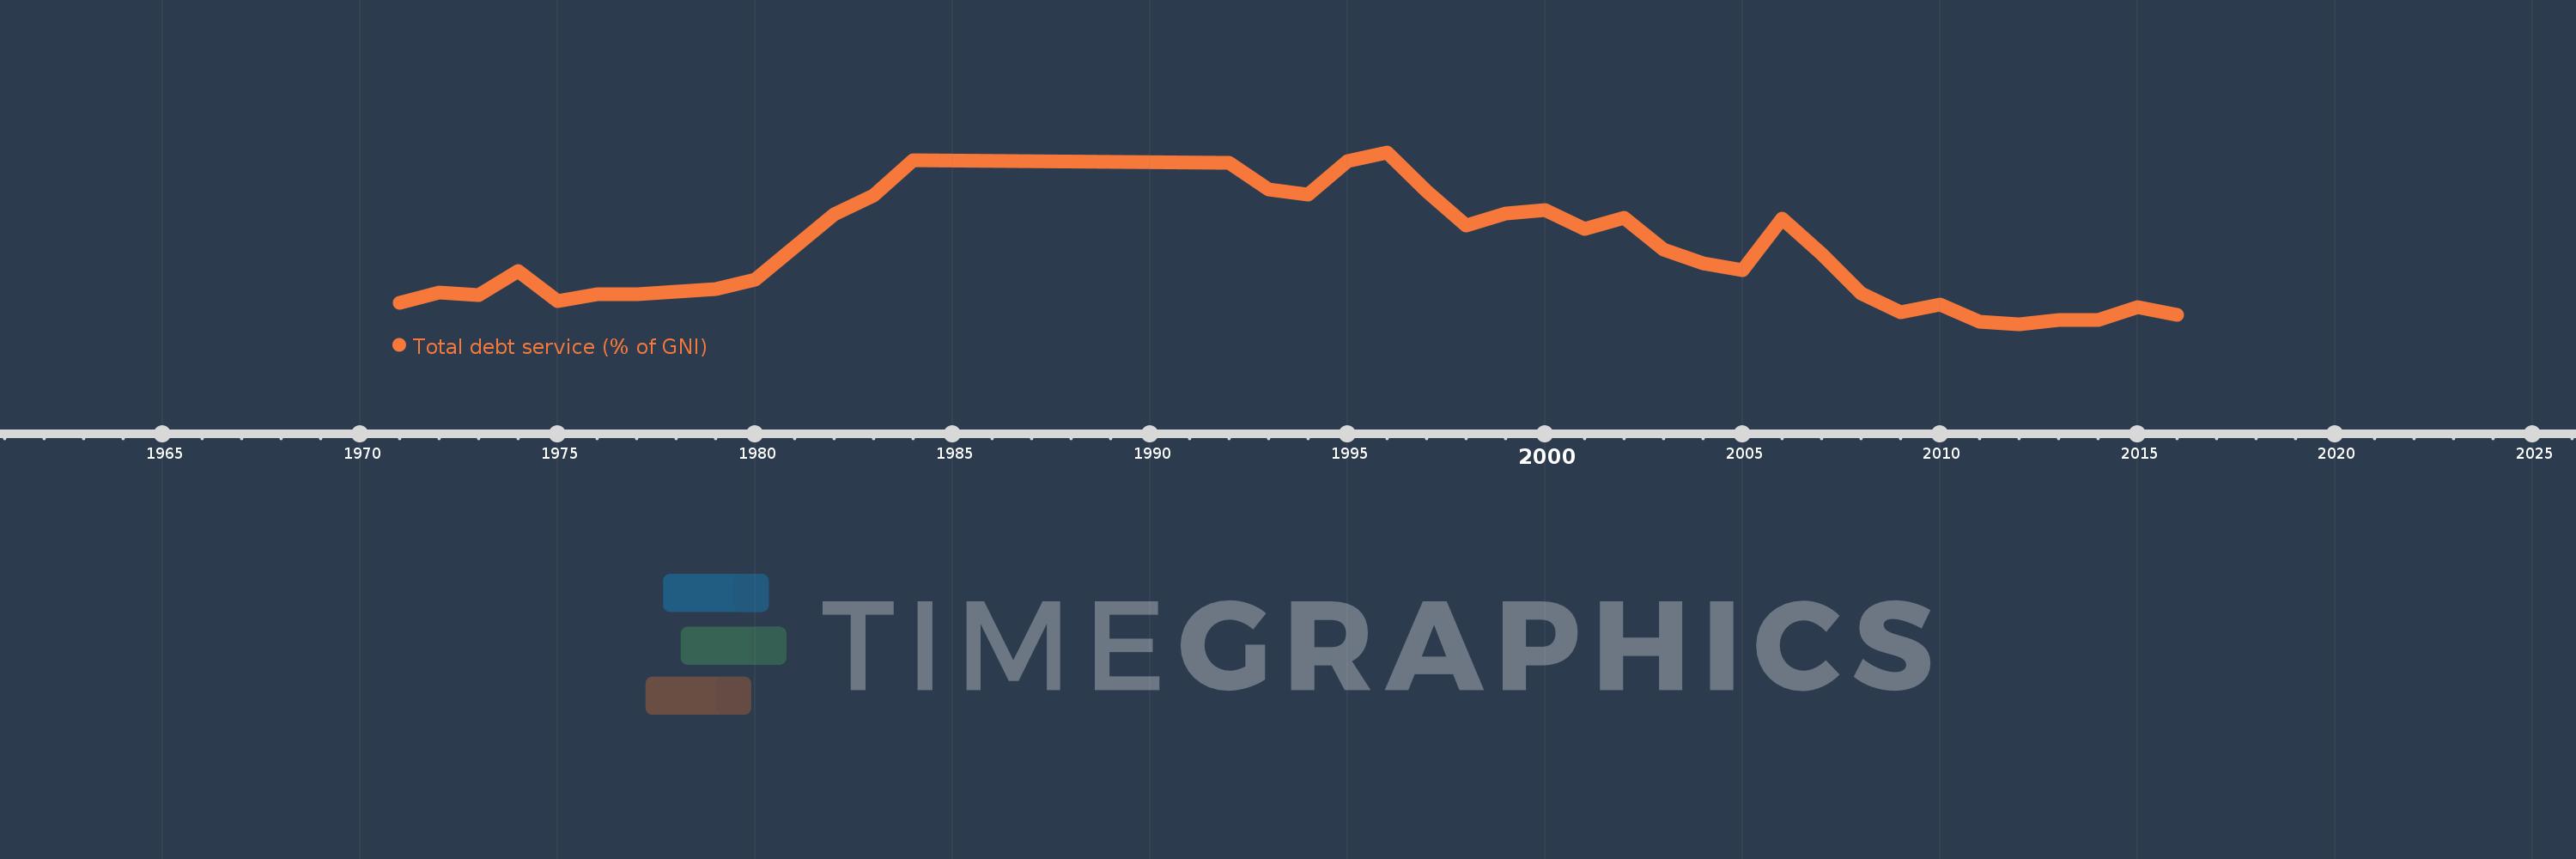
Total debt service (% of GNI)
2016,2015,2014,2013,2012,2011,2010,2009,2008,2007,2006,2005,2004,2003,2002,2001,2000,1999,1998,1997,1996,1995,1994,1993,1992,1984,1983,1982,1980,1979,1978,1977,1976,1975,1974,1973,1972,1971
Cette statistique dans les autres pays:
La ligne de temps
Cette échelle de temps montre un graphique de 1971 année à 2016 année Pre-demographic dividend. Les données jusqu'à 1970 année ne sont pas présentés. Quantité d'observations actuelles selon dates: 38.
Source (désignation):
Les indicateurs du développement mondiale
Source (organisation):
World Bank, International Debt Statistics.
Catégories:
Economy & Growth, External Debt
Dernière mise à jour
23 avr. 2017
Les indicateurs de changement de valeurs selon les années
Minimum:
0.843
1 janv. 2012
Maximum:
7.564
1 janv. 1996
Pour la date d''observation
Valeur
Changement absolu
Le changement par rapport à la valeur précédente
1 janv. 1971
1.695
+1.695
0.0%
1 janv. 1972
2.082
+0.388
22.87%
1 janv. 1973
1.969
-0.113
-5.45%
1 janv. 1974
2.928
+0.959
48.73%
1 janv. 1975
1.732
-1.196
-40.85%
1 janv. 1976
2.01
+0.278
16.04%
1 janv. 1977
2.027
+0.018
0.88%
1 janv. 1978
2.132
+0.105
5.18%
1 janv. 1979
2.208
+0.076
3.56%
1 janv. 1980
2.597
+0.389
17.62%
1 janv. 1982
5.156
+2.559
98.51%
1 janv. 1983
5.896
+0.739
14.34%
1 janv. 1984
7.266
+1.37
23.24%
1 janv. 1992
7.143
-0.123
-1.69%
1 janv. 1993
6.1
-1.043
-14.6%
1 janv. 1994
5.917
-0.183
-3.0%
1 janv. 1995
7.211
+1.294
21.87%
1 janv. 1996
7.564
+0.353
4.89%
1 janv. 1997
6.064
-1.5
-19.83%
1 janv. 1998
4.705
-1.36
-22.42%
1 janv. 1999
5.17
+0.465
9.89%
1 janv. 2000
5.319
+0.149
2.88%
1 janv. 2001
4.571
-0.747
-14.05%
1 janv. 2002
5.0
+0.429
9.38%
1 janv. 2003
3.772
-1.228
-24.55%
1 janv. 2004
3.213
-0.56
-14.83%
1 janv. 2005
2.947
-0.266
-8.28%
1 janv. 2006
4.985
+2.039
69.19%
1 janv. 2007
3.596
-1.389
-27.87%
1 janv. 2008
2.041
-1.555
-43.23%
1 janv. 2009
1.314
-0.727
-35.64%
1 janv. 2010
1.622
+0.308
23.42%
1 janv. 2011
0.927
-0.694
-42.82%
1 janv. 2012
0.843
-0.084
-9.08%
1 janv. 2013
0.996
+0.153
18.1%
1 janv. 2014
0.996
+0.0
0.03%
1 janv. 2015
1.505
+0.509
51.08%
1 janv. 2016
1.216
-0.288
-19.17%
Classement des pays selon les statistiques actuelles par années


Commentaires: