29
/fr/
fr
AIzaSyAYiBZKx7MnpbEhh9jyipgxe19OcubqV5w
April 1, 2024
71956
Armenia
ARM
true
2
1
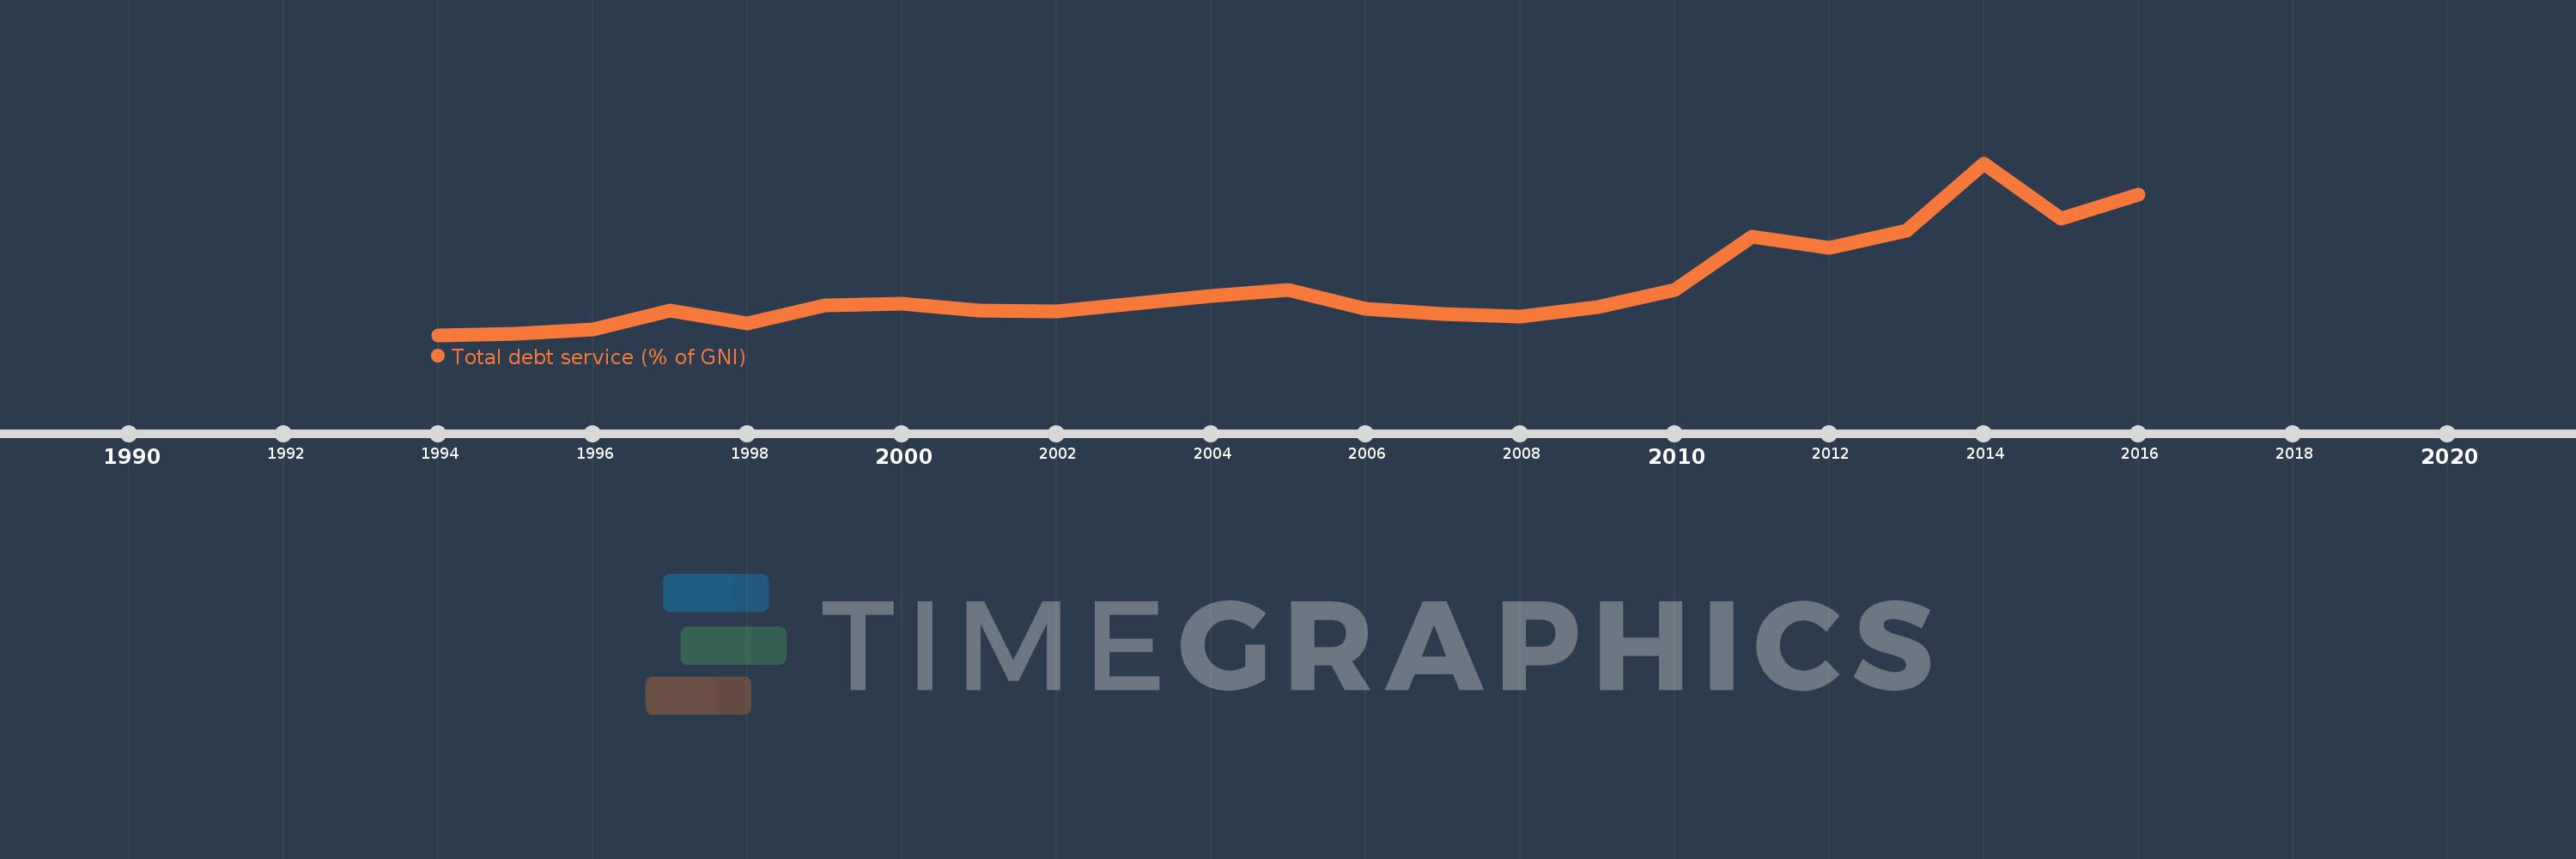
Total debt service (% of GNI)
2016,2015,2014,2013,2012,2011,2010,2009,2008,2007,2006,2005,2004,2003,2002,2001,2000,1999,1998,1997,1996,1995,1994
Cette statistique dans les autres pays:
La ligne de temps
Cette échelle de temps montre un graphique de 1994 année à 2016 année Armenia. Les données jusqu'à 1993 année ne sont pas présentés. Quantité d'observations actuelles selon dates: 23.
Source (désignation):
Les indicateurs du développement mondiale
Source (organisation):
World Bank, International Debt Statistics.
Catégories:
Economy & Growth, External Debt
Dernière mise à jour
23 avr. 2017
Les indicateurs de changement de valeurs selon les années
Minimum:
0.181
1 janv. 1994
Maximum:
17.342
1 janv. 2014
Pour la date d''observation
Valeur
Changement absolu
Le changement par rapport à la valeur précédente
1 janv. 1994
0.181
+0.181
0.0%
1 janv. 1995
0.338
+0.156
86.1%
1 janv. 1996
0.769
+0.431
127.67%
1 janv. 1997
2.601
+1.832
238.27%
1 janv. 1998
1.379
-1.222
-46.99%
1 janv. 1999
3.141
+1.762
127.8%
1 janv. 2000
3.323
+0.182
5.78%
1 janv. 2001
2.587
-0.736
-22.15%
1 janv. 2002
2.565
-0.022
-0.84%
1 janv. 2003
3.353
+0.788
30.73%
1 janv. 2004
4.065
+0.712
21.23%
1 janv. 2005
4.66
+0.595
14.64%
1 janv. 2006
2.786
-1.874
-40.22%
1 janv. 2007
2.319
-0.467
-16.78%
1 janv. 2008
2.009
-0.309
-13.35%
1 janv. 2009
2.984
+0.975
48.53%
1 janv. 2010
4.706
+1.721
57.68%
1 janv. 2011
9.975
+5.269
111.97%
1 janv. 2012
8.913
-1.061
-10.64%
1 janv. 2013
10.647
+1.733
19.45%
1 janv. 2014
17.342
+6.696
62.89%
1 janv. 2015
11.816
-5.526
-31.87%
1 janv. 2016
14.191
+2.375
20.1%
Classement des pays selon les statistiques actuelles par années


Commentaires: