29
/fr/
fr
AIzaSyAYiBZKx7MnpbEhh9jyipgxe19OcubqV5w
April 1, 2024
87609
Bolivia
BOL
true
2
1
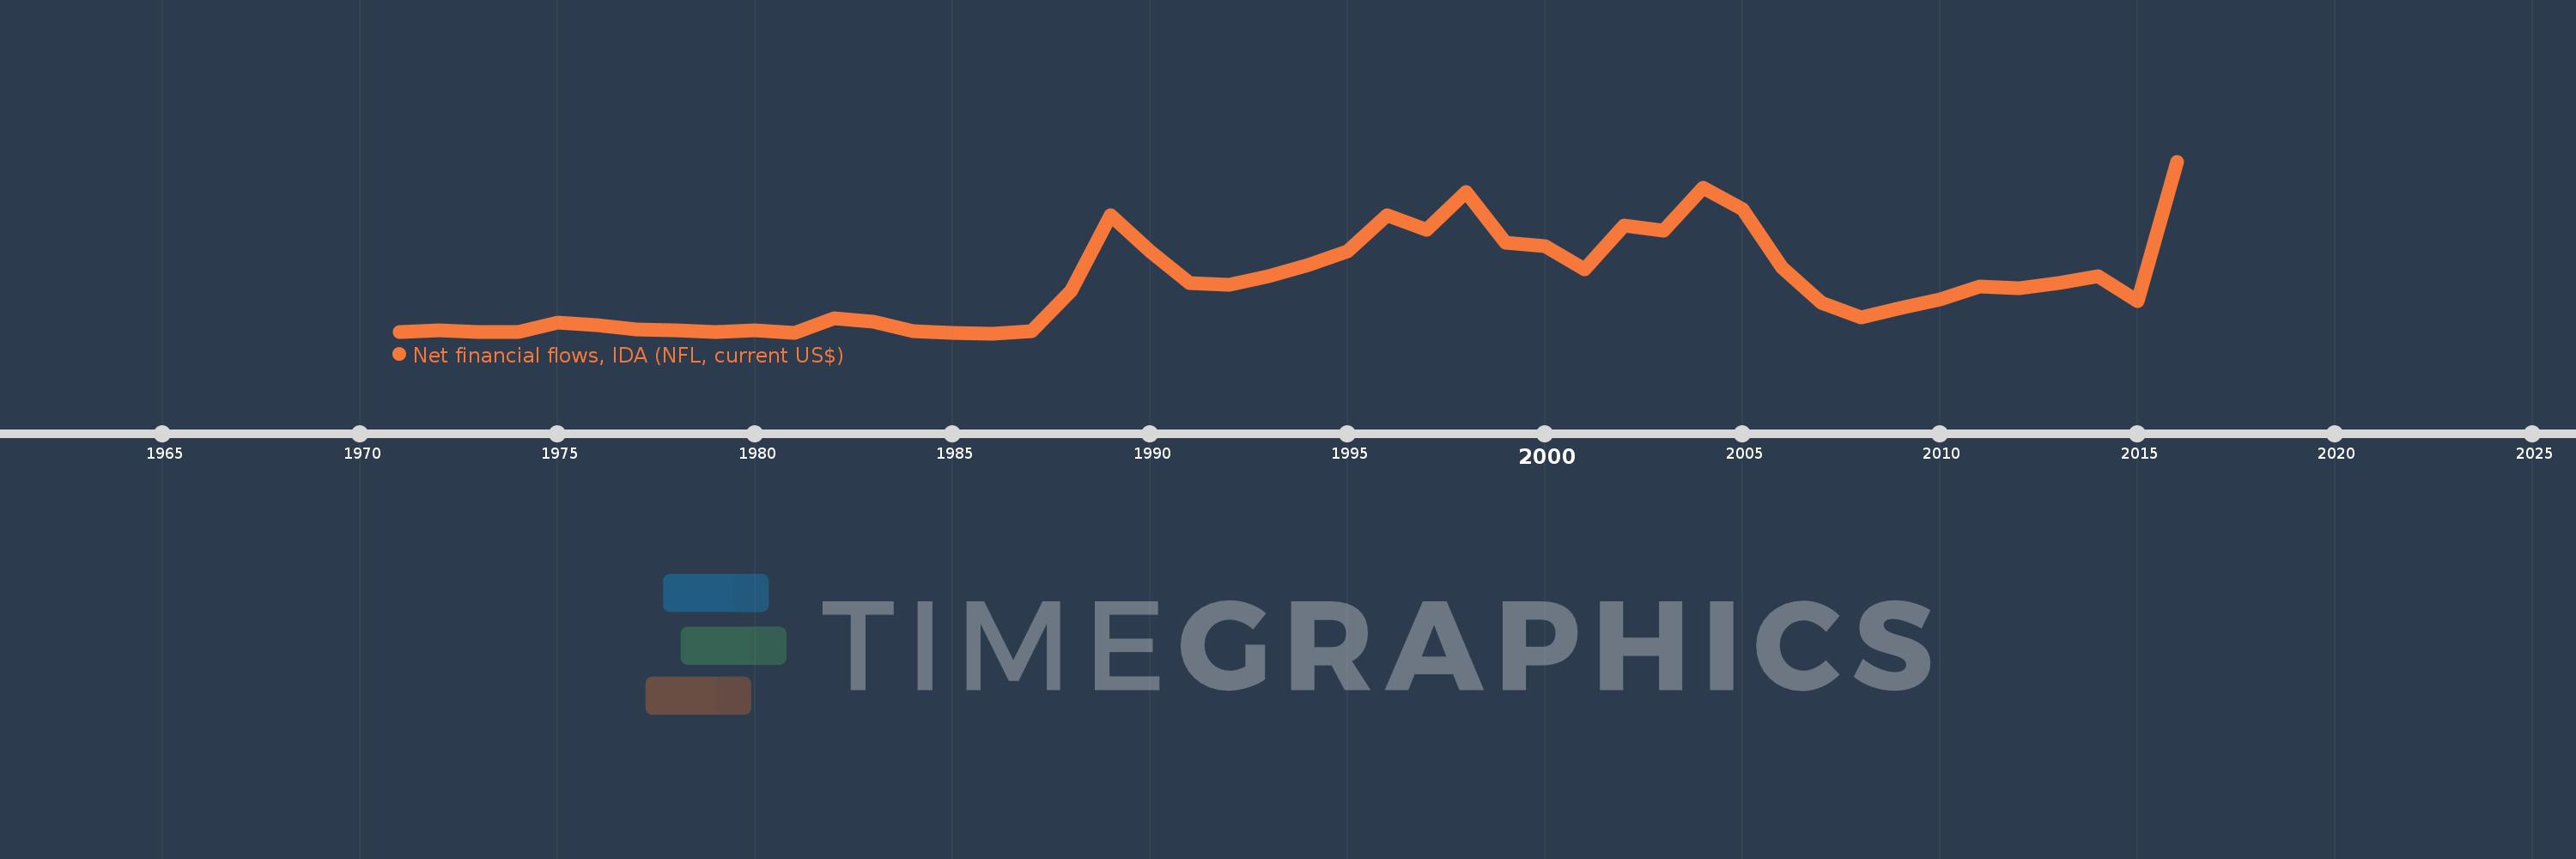
Net financial flows, IDA (NFL, current US$)
2016,2015,2014,2013,2012,2011,2010,2009,2008,2007,2006,2005,2004,2003,2002,2001,2000,1999,1998,1997,1996,1995,1994,1993,1992,1991,1990,1989,1988,1987,1986,1985,1984,1983,1982,1981,1980,1979,1978,1977,1976,1975,1974,1973,1972,1971
Cette statistique dans les autres pays:
La ligne de temps
Cette échelle de temps montre un graphique de 1971 année à 2016 année Bolivia. Les données jusqu'à 1970 année ne sont pas présentés. Quantité d'observations actuelles selon dates: 46.
Source (désignation):
Les indicateurs du développement mondiale
Source (organisation):
World Bank, International Debt Statistics.
Catégories:
External Debt
Dernière mise à jour
23 avr. 2017
Les indicateurs de changement de valeurs selon les années
Minimum:
700.0 milles
1 janv. 1986
Maximum:
160.639 mln.
1 janv. 2016
Pour la date d''observation
Valeur
Changement absolu
Le changement par rapport à la valeur précédente
1 janv. 1971
1.879 mln.
+1.879 mln.
0.0%
1 janv. 1972
3.787 mln.
+1.908 mln.
101.54%
1 janv. 1973
2.076 mln.
-1.711 mln.
-45.18%
1 janv. 1974
1.858 mln.
-218.0 milles
-10.5%
1 janv. 1975
10.551 mln.
+8.693 mln.
467.87%
1 janv. 1976
8.61 mln.
-1.941 mln.
-18.4%
1 janv. 1977
3.923 mln.
-4.687 mln.
-54.44%
1 janv. 1978
3.677 mln.
-246.0 milles
-6.27%
1 janv. 1979
1.98 mln.
-1.697 mln.
-46.15%
1 janv. 1980
3.264 mln.
+1.284 mln.
64.85%
1 janv. 1981
1.47 mln.
-1.794 mln.
-54.96%
1 janv. 1982
14.518 mln.
+13.048 mln.
887.62%
1 janv. 1983
11.358 mln.
-3.16 mln.
-21.77%
1 janv. 1984
2.748 mln.
-8.61 mln.
-75.81%
1 janv. 1985
1.292 mln.
-1.456 mln.
-52.98%
1 janv. 1986
700.0 milles
-592.0 milles
-45.82%
1 janv. 1987
2.951 mln.
+2.251 mln.
321.57%
1 janv. 1988
40.263 mln.
+37.312 mln.
1.26 milles%
1 janv. 1989
110.367 mln.
+70.104 mln.
174.12%
1 janv. 1990
77.377 mln.
-32.99 mln.
-29.89%
1 janv. 1991
47.084 mln.
-30.293 mln.
-39.15%
1 janv. 1992
46.157 mln.
-927.0 milles
-1.97%
1 janv. 1993
53.518 mln.
+7.361 mln.
15.95%
1 janv. 1994
63.914 mln.
+10.396 mln.
19.43%
1 janv. 1995
77.347 mln.
+13.433 mln.
21.02%
1 janv. 1996
110.482 mln.
+33.135 mln.
42.84%
1 janv. 1997
96.938 mln.
-13.544 mln.
-12.26%
1 janv. 1998
132.152 mln.
+35.214 mln.
36.33%
1 janv. 1999
84.966 mln.
-47.186 mln.
-35.71%
1 janv. 2000
81.998 mln.
-2.968 mln.
-3.49%
1 janv. 2001
60.599 mln.
-21.399 mln.
-26.1%
1 janv. 2002
101.335 mln.
+40.736 mln.
67.22%
1 janv. 2003
96.446 mln.
-4.889 mln.
-4.82%
1 janv. 2004
136.441 mln.
+39.995 mln.
41.47%
1 janv. 2005
116.58 mln.
-19.861 mln.
-14.56%
1 janv. 2006
62.151 mln.
-54.429 mln.
-46.69%
1 janv. 2007
28.857 mln.
-33.294 mln.
-53.57%
1 janv. 2008
15.693 mln.
-13.164 mln.
-45.62%
1 janv. 2009
24.324 mln.
+8.631 mln.
55.0%
1 janv. 2010
32.268 mln.
+7.944 mln.
32.66%
1 janv. 2011
43.989 mln.
+11.721 mln.
36.32%
1 janv. 2012
42.414 mln.
-1.575 mln.
-3.58%
1 janv. 2013
47.266 mln.
+4.852 mln.
11.44%
1 janv. 2014
54.128 mln.
+6.862 mln.
14.52%
1 janv. 2015
30.859 mln.
-23.269 mln.
-42.99%
1 janv. 2016
160.639 mln.
+129.78 mln.
420.56%
Classement des pays selon les statistiques actuelles par années


Commentaires: