29
/fr/
fr
AIzaSyAYiBZKx7MnpbEhh9jyipgxe19OcubqV5w
April 1, 2024
207118
Nepal
NPL
true
2
1
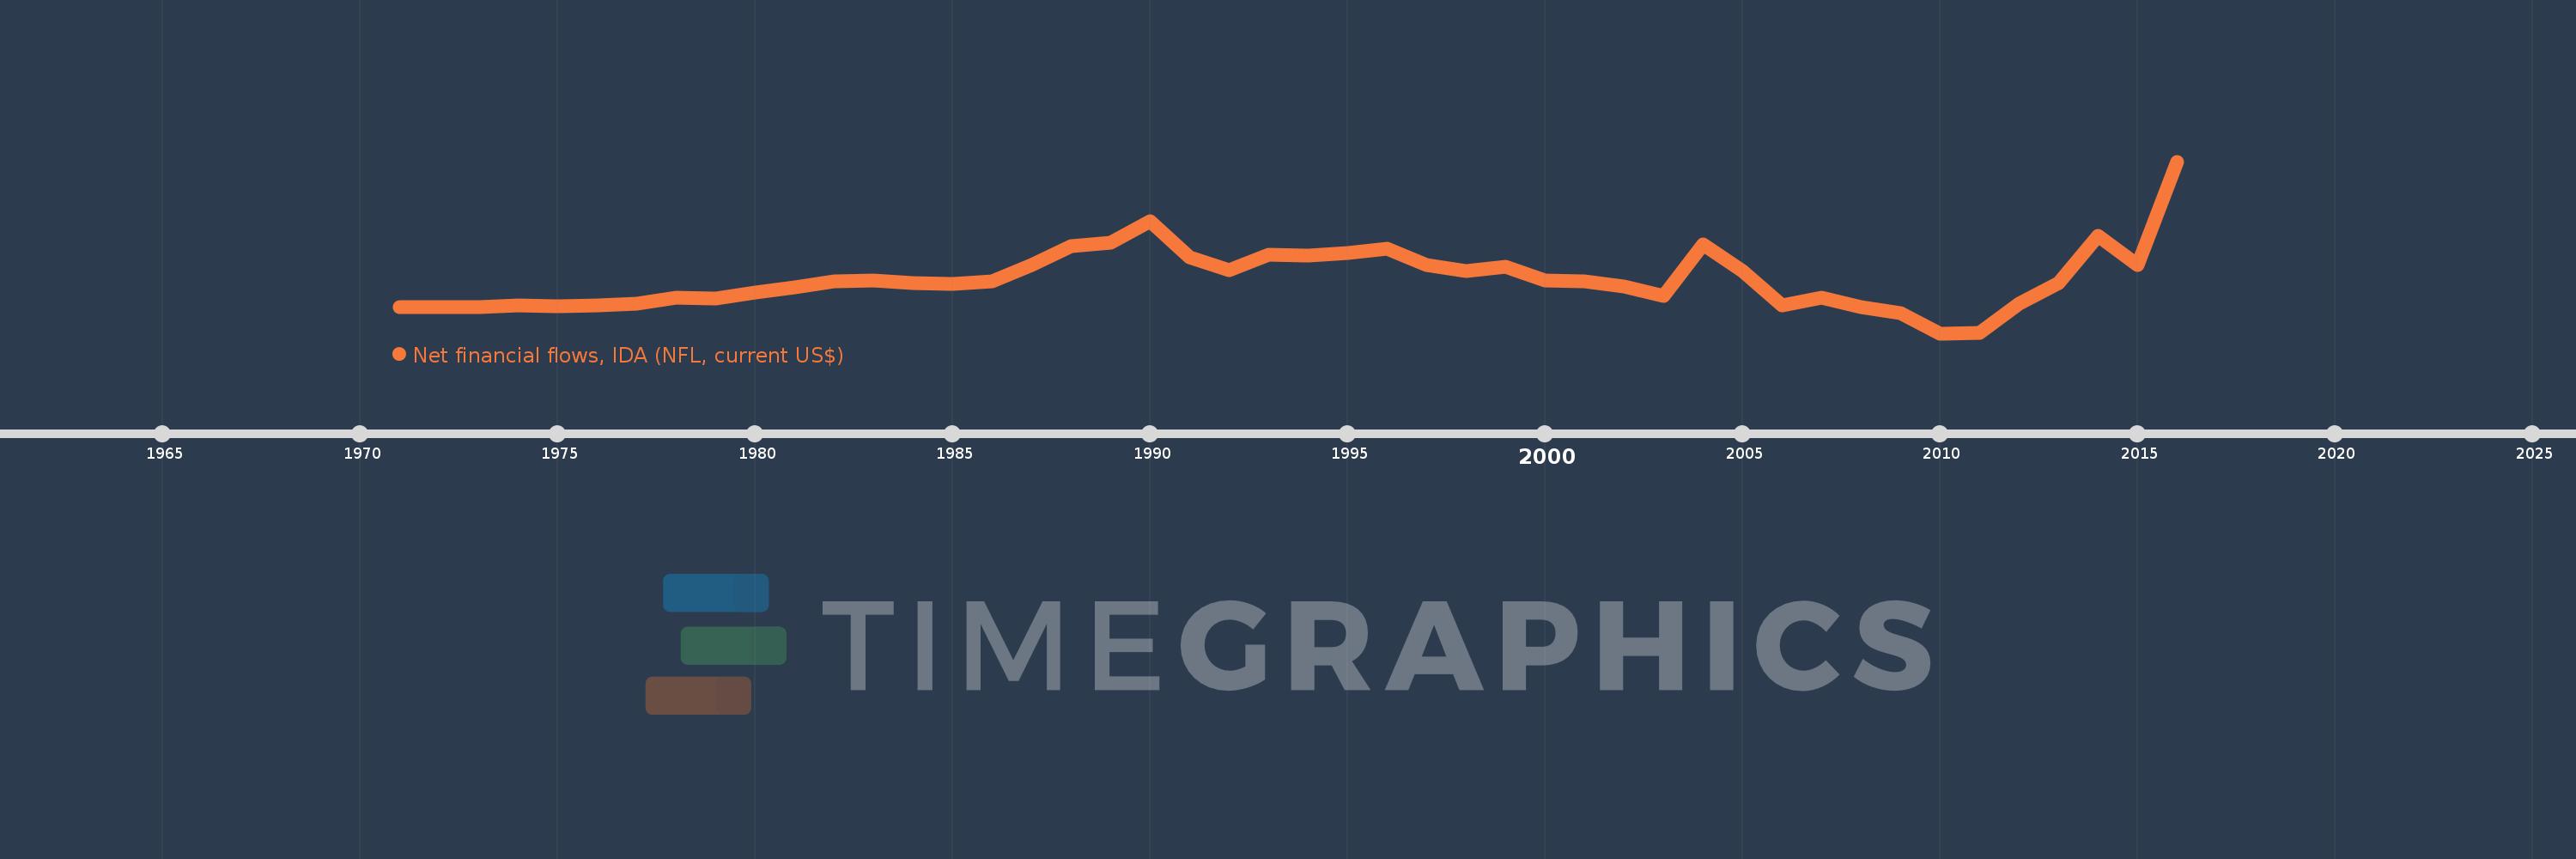
Net financial flows, IDA (NFL, current US$)
2016,2015,2014,2013,2012,2011,2010,2009,2008,2007,2006,2005,2004,2003,2002,2001,2000,1999,1998,1997,1996,1995,1994,1993,1992,1991,1990,1989,1988,1987,1986,1985,1984,1983,1982,1981,1980,1979,1978,1977,1976,1975,1974,1973,1972,1971
Cette statistique dans les autres pays:
La ligne de temps
Cette échelle de temps montre un graphique de 1971 année à 2016 année Nepal. Les données jusqu'à 1970 année ne sont pas présentés. Quantité d'observations actuelles selon dates: 46.
Source (désignation):
Les indicateurs du développement mondiale
Source (organisation):
World Bank, International Debt Statistics.
Catégories:
External Debt
Dernière mise à jour
23 avr. 2017
Les indicateurs de changement de valeurs selon les années
Minimum:
-33.461 mln.
1 janv. 2010
Maximum:
185.243 mln.
1 janv. 2016
Pour la date d''observation
Valeur
Changement absolu
Le changement par rapport à la valeur précédente
1 janv. 1971
93.0 milles
+93.0 milles
0.0%
1 janv. 1972
193.0 milles
+100.0 milles
107.53%
1 janv. 1973
89.0 milles
-104.0 milles
-53.89%
1 janv. 1974
1.608 mln.
+1.519 mln.
1.71 milles%
1 janv. 1975
1.163 mln.
-445.0 milles
-27.67%
1 janv. 1976
2.323 mln.
+1.16 mln.
99.74%
1 janv. 1977
3.76 mln.
+1.437 mln.
61.86%
1 janv. 1978
12.232 mln.
+8.472 mln.
225.32%
1 janv. 1979
11.026 mln.
-1.206 mln.
-9.86%
1 janv. 1980
18.586 mln.
+7.56 mln.
68.57%
1 janv. 1981
25.025 mln.
+6.439 mln.
34.64%
1 janv. 1982
32.853 mln.
+7.828 mln.
31.28%
1 janv. 1983
33.544 mln.
+691.0 milles
2.1%
1 janv. 1984
30.911 mln.
-2.633 mln.
-7.85%
1 janv. 1985
29.269 mln.
-1.642 mln.
-5.31%
1 janv. 1986
32.471 mln.
+3.202 mln.
10.94%
1 janv. 1987
53.087 mln.
+20.616 mln.
63.49%
1 janv. 1988
77.794 mln.
+24.707 mln.
46.54%
1 janv. 1989
82.408 mln.
+4.614 mln.
5.93%
1 janv. 1990
108.967 mln.
+26.559 mln.
32.23%
1 janv. 1991
63.827 mln.
-45.14 mln.
-41.43%
1 janv. 1992
46.828 mln.
-16.999 mln.
-26.63%
1 janv. 1993
66.862 mln.
+20.034 mln.
42.78%
1 janv. 1994
65.564 mln.
-1.298 mln.
-1.94%
1 janv. 1995
69.304 mln.
+3.74 mln.
5.7%
1 janv. 1996
74.61 mln.
+5.306 mln.
7.66%
1 janv. 1997
53.889 mln.
-20.721 mln.
-27.77%
1 janv. 1998
45.484 mln.
-8.405 mln.
-15.6%
1 janv. 1999
51.537 mln.
+6.053 mln.
13.31%
1 janv. 2000
33.896 mln.
-17.641 mln.
-34.23%
1 janv. 2001
33.168 mln.
-728.0 milles
-2.15%
1 janv. 2002
26.203 mln.
-6.965 mln.
-21.0%
1 janv. 2003
14.458 mln.
-11.745 mln.
-44.82%
1 janv. 2004
79.319 mln.
+64.861 mln.
448.62%
1 janv. 2005
45.296 mln.
-34.023 mln.
-42.89%
1 janv. 2006
2.521 mln.
-42.775 mln.
-94.43%
1 janv. 2007
12.351 mln.
+9.83 mln.
389.92%
1 janv. 2008
312.0 milles
-12.039 mln.
-97.47%
1 janv. 2009
-7.877 mln.
-8.189 mln.
-2.62 milles%
1 janv. 2010
-33.461 mln.
-25.584 mln.
324.79%
1 janv. 2011
-32.643 mln.
+818.0 milles
-2.44%
1 janv. 2012
4.036 mln.
+36.679 mln.
-112.36%
1 janv. 2013
30.667 mln.
+26.631 mln.
659.84%
1 janv. 2014
90.677 mln.
+60.01 mln.
195.68%
1 janv. 2015
53.338 mln.
-37.339 mln.
-41.18%
1 janv. 2016
185.243 mln.
+131.905 mln.
247.3%
Classement des pays selon les statistiques actuelles par années


Commentaires: