29
/fr/
fr
AIzaSyAYiBZKx7MnpbEhh9jyipgxe19OcubqV5w
April 1, 2024
29347
East Asia & Pacific (IDA & IBRD countries)
TEA
false
2
1
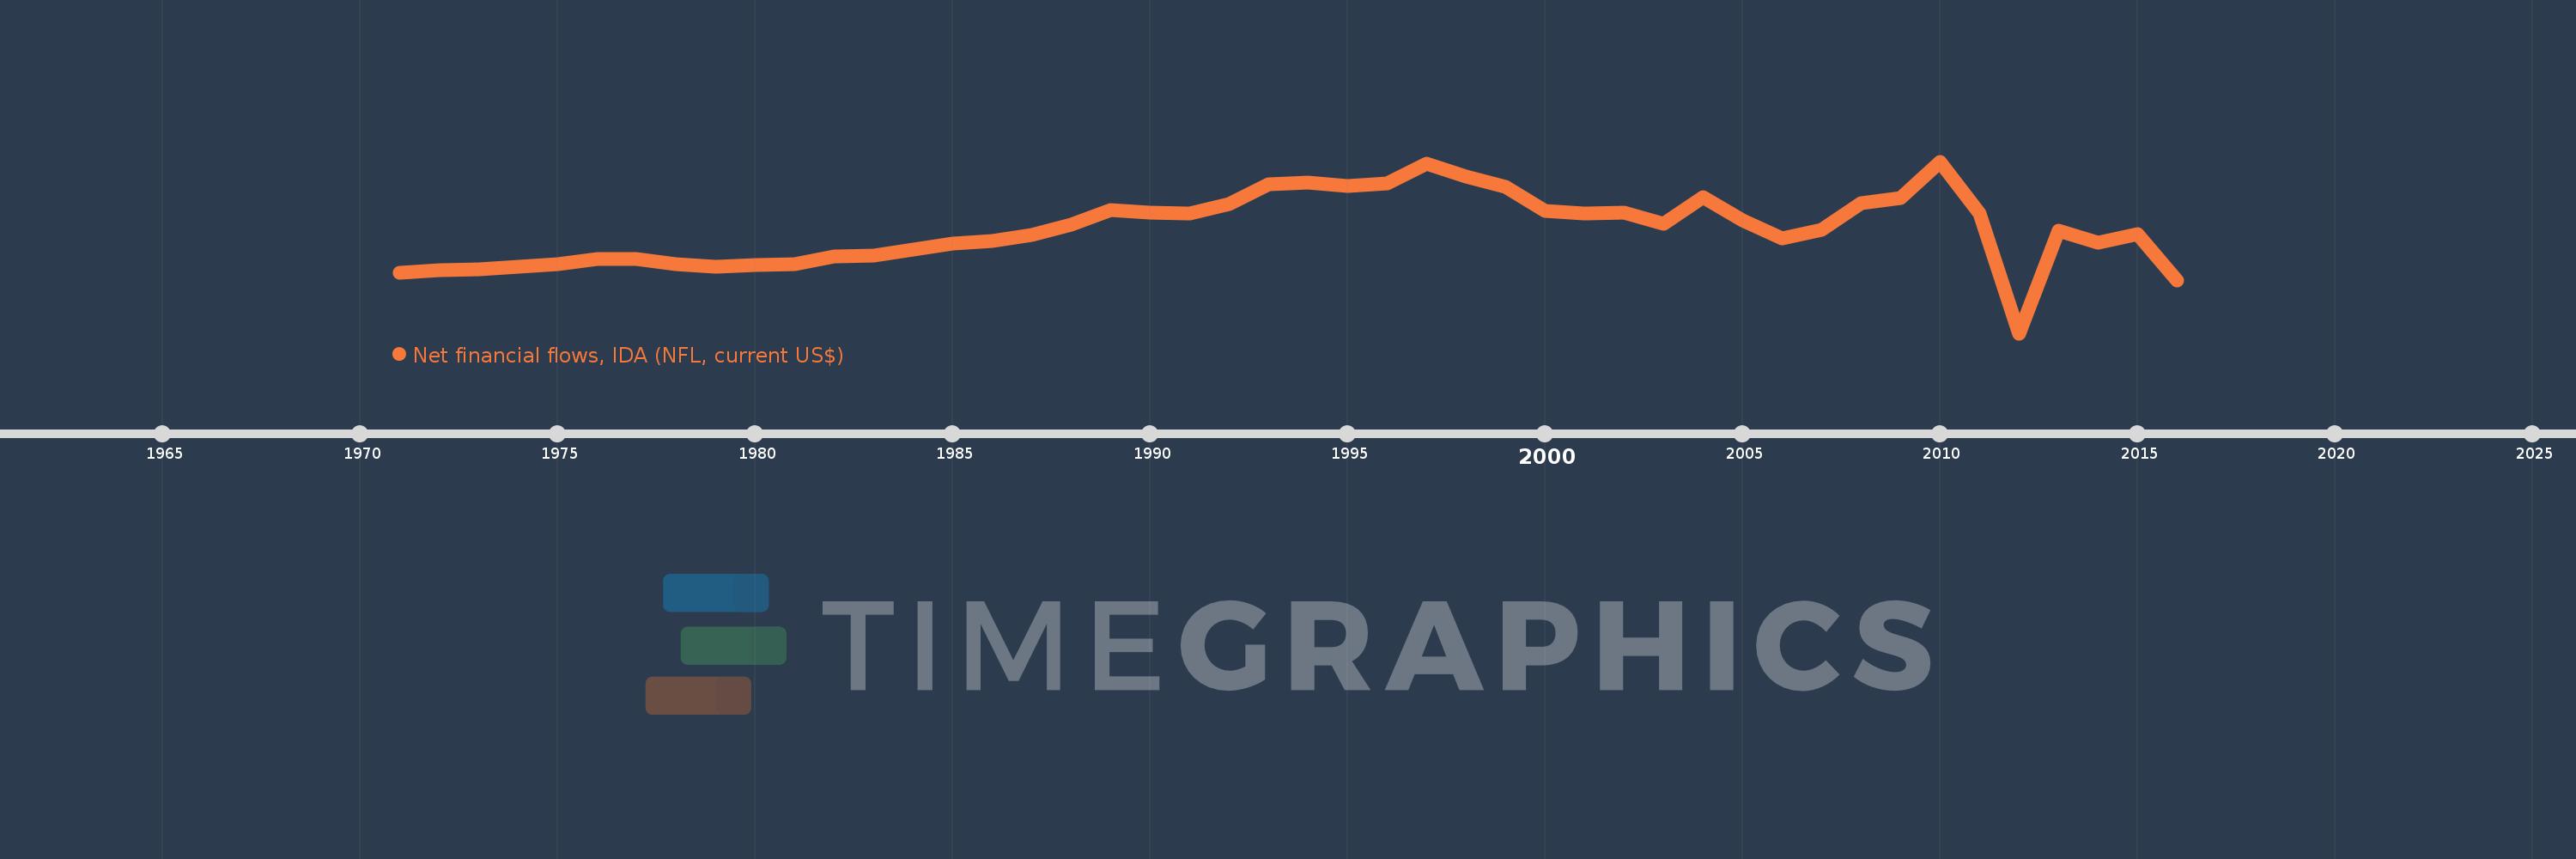
Net financial flows, IDA (NFL, current US$)
2016,2015,2014,2013,2012,2011,2010,2009,2008,2007,2006,2005,2004,2003,2002,2001,2000,1999,1998,1997,1996,1995,1994,1993,1992,1991,1990,1989,1988,1987,1986,1985,1984,1983,1982,1981,1980,1979,1978,1977,1976,1975,1974,1973,1972,1971
Cette statistique dans les autres pays:
La ligne de temps
Cette échelle de temps montre un graphique de 1971 année à 2016 année East Asia & Pacific (IDA & IBRD countries). Les données jusqu'à 1970 année ne sont pas présentés. Quantité d'observations actuelles selon dates: 46.
Source (désignation):
Les indicateurs du développement mondiale
Source (organisation):
World Bank, International Debt Statistics.
Catégories:
External Debt
Dernière mise à jour
23 avr. 2017
Les indicateurs de changement de valeurs selon les années
Minimum:
-588.841 mln.
1 janv. 2012
Maximum:
1.1 mds
1 janv. 2010
Pour la date d''observation
Valeur
Changement absolu
Le changement par rapport à la valeur précédente
1 janv. 1971
3.976 mln.
+3.976 mln.
0.0%
1 janv. 1972
30.747 mln.
+26.771 mln.
673.31%
1 janv. 1973
36.467 mln.
+5.72 mln.
18.6%
1 janv. 1974
61.341 mln.
+24.874 mln.
68.21%
1 janv. 1975
93.702 mln.
+32.361 mln.
52.76%
1 janv. 1976
142.429 mln.
+48.727 mln.
52.0%
1 janv. 1977
138.054 mln.
-4.375 mln.
-3.07%
1 janv. 1978
89.711 mln.
-48.343 mln.
-35.02%
1 janv. 1979
64.813 mln.
-24.898 mln.
-27.75%
1 janv. 1980
81.544 mln.
+16.731 mln.
25.81%
1 janv. 1981
89.863 mln.
+8.319 mln.
10.2%
1 janv. 1982
164.296 mln.
+74.433 mln.
82.83%
1 janv. 1983
179.057 mln.
+14.761 mln.
8.98%
1 janv. 1984
237.553 mln.
+58.496 mln.
32.67%
1 janv. 1985
294.646 mln.
+57.093 mln.
24.03%
1 janv. 1986
318.194 mln.
+23.548 mln.
7.99%
1 janv. 1987
377.892 mln.
+59.698 mln.
18.76%
1 janv. 1988
481.196 mln.
+103.304 mln.
27.34%
1 janv. 1989
626.656 mln.
+145.46 mln.
30.23%
1 janv. 1990
594.742 mln.
-31.914 mln.
-5.09%
1 janv. 1991
585.232 mln.
-9.51 mln.
-1.6%
1 janv. 1992
681.817 mln.
+96.585 mln.
16.5%
1 janv. 1993
877.093 mln.
+195.276 mln.
28.64%
1 janv. 1994
891.202 mln.
+14.109 mln.
1.61%
1 janv. 1995
860.489 mln.
-30.713 mln.
-3.45%
1 janv. 1996
883.737 mln.
+23.248 mln.
2.7%
1 janv. 1997
1.077 mds
+193.152 mln.
21.86%
1 janv. 1998
952.022 mln.
-124.867 mln.
-11.6%
1 janv. 1999
851.623 mln.
-100.399 mln.
-10.55%
1 janv. 2000
615.324 mln.
-236.299 mln.
-27.75%
1 janv. 2001
593.021 mln.
-22.303 mln.
-3.62%
1 janv. 2002
600.471 mln.
+7.45 mln.
1.26%
1 janv. 2003
489.353 mln.
-111.118 mln.
-18.51%
1 janv. 2004
745.556 mln.
+256.203 mln.
52.36%
1 janv. 2005
525.569 mln.
-219.987 mln.
-29.51%
1 janv. 2006
340.053 mln.
-185.516 mln.
-35.3%
1 janv. 2007
430.311 mln.
+90.258 mln.
26.54%
1 janv. 2008
689.917 mln.
+259.606 mln.
60.33%
1 janv. 2009
738.533 mln.
+48.616 mln.
7.05%
1 janv. 2010
1.1 mds
+361.144 mln.
48.9%
1 janv. 2011
589.617 mln.
-510.06 mln.
-46.38%
1 janv. 2012
-588.841 mln.
-1.178 mds
-199.87%
1 janv. 2013
417.36 mln.
+1.006 mds
-170.88%
1 janv. 2014
305.214 mln.
-112.146 mln.
-26.87%
1 janv. 2015
384.964 mln.
+79.75 mln.
26.13%
1 janv. 2016
-66.613 mln.
-451.577 mln.
-117.3%
Classement des pays selon les statistiques actuelles par années


Commentaires: