29
/fr/
fr
AIzaSyAYiBZKx7MnpbEhh9jyipgxe19OcubqV5w
April 1, 2024
86270
Bhutan
BTN
true
2
1
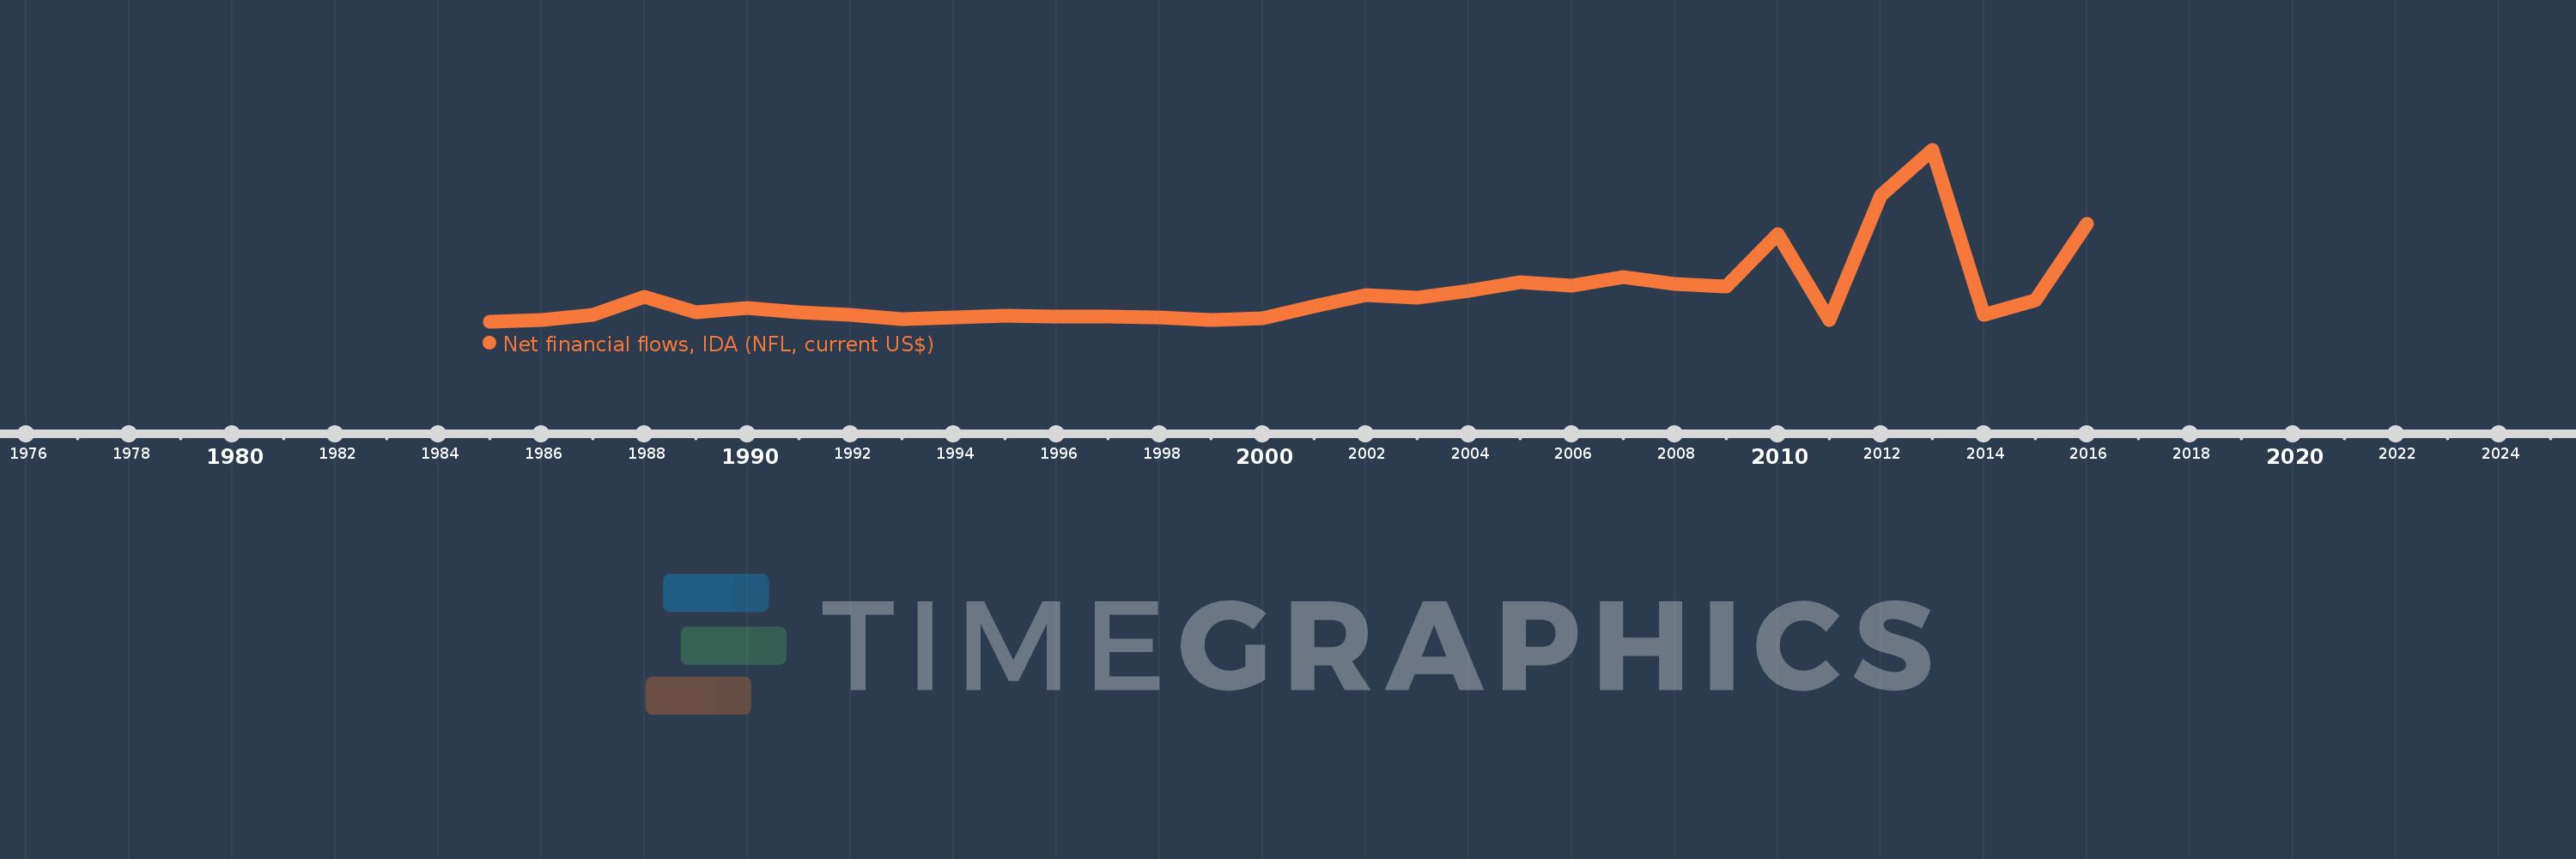
Net financial flows, IDA (NFL, current US$)
2016,2015,2014,2013,2012,2011,2010,2009,2008,2007,2006,2005,2004,2003,2002,2001,2000,1999,1998,1997,1996,1995,1994,1993,1992,1991,1990,1989,1988,1987,1986,1985
Cette statistique dans les autres pays:
La ligne de temps
Cette échelle de temps montre un graphique de 1985 année à 2016 année Bhutan. Les données jusqu'à 1984 année ne sont pas présentés. Quantité d'observations actuelles selon dates: 32.
Source (désignation):
Les indicateurs du développement mondiale
Source (organisation):
World Bank, International Debt Statistics.
Catégories:
External Debt
Dernière mise à jour
23 avr. 2017
Les indicateurs de changement de valeurs selon les années
Minimum:
21.0 milles
1 janv. 1985
Maximum:
36.436 mln.
1 janv. 2013
Pour la date d''observation
Valeur
Changement absolu
Le changement par rapport à la valeur précédente
1 janv. 1985
21.0 milles
+21.0 milles
0.0%
1 janv. 1986
487.0 milles
+466.0 milles
2.22 milles%
1 janv. 1987
1.619 mln.
+1.132 mln.
232.44%
1 janv. 1988
5.379 mln.
+3.76 mln.
232.24%
1 janv. 1989
2.133 mln.
-3.246 mln.
-60.35%
1 janv. 1990
2.928 mln.
+795.0 milles
37.27%
1 janv. 1991
1.99 mln.
-938.0 milles
-32.04%
1 janv. 1992
1.479 mln.
-511.0 milles
-25.68%
1 janv. 1993
626.0 milles
-853.0 milles
-57.67%
1 janv. 1994
902.0 milles
+276.0 milles
44.09%
1 janv. 1995
1.279 mln.
+377.0 milles
41.8%
1 janv. 1996
1.093 mln.
-186.0 milles
-14.54%
1 janv. 1997
1.174 mln.
+81.0 milles
7.41%
1 janv. 1998
940.0 milles
-234.0 milles
-19.93%
1 janv. 1999
517.0 milles
-423.0 milles
-45.0%
1 janv. 2000
731.0 milles
+214.0 milles
41.39%
1 janv. 2001
3.313 mln.
+2.582 mln.
353.21%
1 janv. 2002
5.701 mln.
+2.388 mln.
72.08%
1 janv. 2003
5.218 mln.
-483.0 milles
-8.47%
1 janv. 2004
6.596 mln.
+1.378 mln.
26.41%
1 janv. 2005
8.426 mln.
+1.83 mln.
27.74%
1 janv. 2006
7.684 mln.
-742.0 milles
-8.81%
1 janv. 2007
9.503 mln.
+1.819 mln.
23.67%
1 janv. 2008
8.049 mln.
-1.454 mln.
-15.3%
1 janv. 2009
7.536 mln.
-513.0 milles
-6.37%
1 janv. 2010
18.715 mln.
+11.179 mln.
148.34%
1 janv. 2011
404.0 milles
-18.311 mln.
-97.84%
1 janv. 2012
26.878 mln.
+26.474 mln.
6.55 milles%
1 janv. 2013
36.436 mln.
+9.558 mln.
35.56%
1 janv. 2014
1.576 mln.
-34.86 mln.
-95.67%
1 janv. 2015
4.649 mln.
+3.073 mln.
194.99%
1 janv. 2016
20.749 mln.
+16.1 mln.
346.31%
Classement des pays selon les statistiques actuelles par années


Commentaires: