29
/fr/
fr
AIzaSyAYiBZKx7MnpbEhh9jyipgxe19OcubqV5w
April 1, 2024
269711
Turkey
TUR
true
2
1
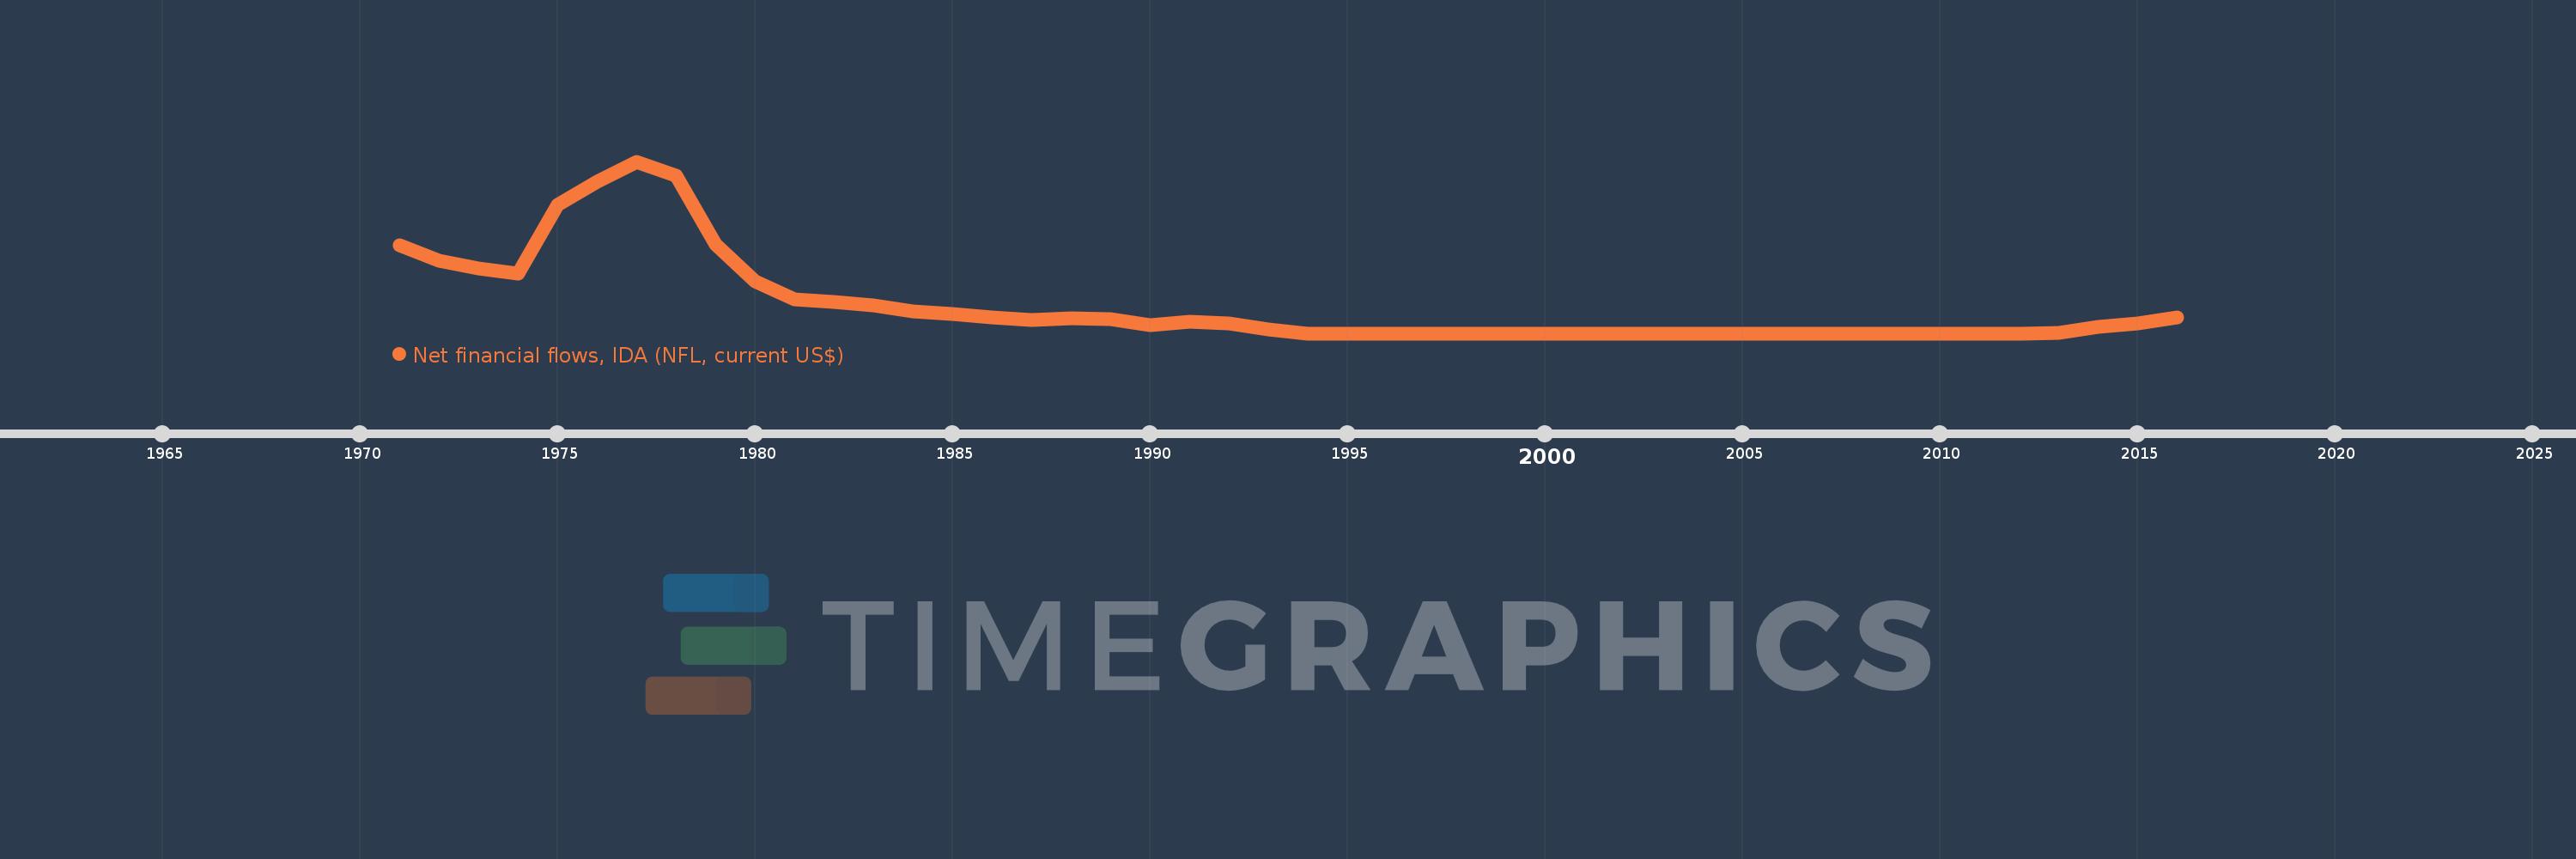
Net financial flows, IDA (NFL, current US$)
2016,2015,2014,2013,2012,2011,2010,2009,2008,2007,2006,2005,2004,2003,2002,2001,2000,1999,1998,1997,1996,1995,1994,1993,1992,1991,1990,1989,1988,1987,1986,1985,1984,1983,1982,1981,1980,1979,1978,1977,1976,1975,1974,1973,1972,1971
Cette statistique dans les autres pays:
La ligne de temps
Cette échelle de temps montre un graphique de 1971 année à 2016 année Turkey. Les données jusqu'à 1970 année ne sont pas présentés. Quantité d'observations actuelles selon dates: 46.
Source (désignation):
Les indicateurs du développement mondiale
Source (organisation):
World Bank, International Debt Statistics.
Catégories:
External Debt
Dernière mise à jour
23 avr. 2017
Les indicateurs de changement de valeurs selon les années
Minimum:
-5.886 mln.
1 janv. 1994
Maximum:
19.812 mln.
1 janv. 1977
Pour la date d''observation
Valeur
Changement absolu
Le changement par rapport à la valeur précédente
1 janv. 1971
7.233 mln.
+7.233 mln.
0.0%
1 janv. 1972
4.922 mln.
-2.311 mln.
-31.95%
1 janv. 1973
3.796 mln.
-1.126 mln.
-22.88%
1 janv. 1974
3.01 mln.
-786.0 milles
-20.71%
1 janv. 1975
13.327 mln.
+10.317 mln.
342.76%
1 janv. 1976
16.731 mln.
+3.404 mln.
25.54%
1 janv. 1977
19.812 mln.
+3.081 mln.
18.41%
1 janv. 1978
17.702 mln.
-2.11 mln.
-10.65%
1 janv. 1979
7.428 mln.
-10.274 mln.
-58.04%
1 janv. 1980
1.826 mln.
-5.602 mln.
-75.42%
1 janv. 1981
-863.0 milles
-2.689 mln.
-147.26%
1 janv. 1982
-1.233 mln.
-370.0 milles
42.87%
1 janv. 1983
-1.656 mln.
-423.0 milles
34.31%
1 janv. 1984
-2.596 mln.
-940.0 milles
56.76%
1 janv. 1985
-2.946 mln.
-350.0 milles
13.48%
1 janv. 1986
-3.541 mln.
-595.0 milles
20.2%
1 janv. 1987
-3.902 mln.
-361.0 milles
10.19%
1 janv. 1988
-3.655 mln.
+247.0 milles
-6.33%
1 janv. 1989
-3.715 mln.
-60.0 milles
1.64%
1 janv. 1990
-4.614 mln.
-899.0 milles
24.2%
1 janv. 1991
-4.184 mln.
+430.0 milles
-9.32%
1 janv. 1992
-4.424 mln.
-240.0 milles
5.74%
1 janv. 1993
-5.27 mln.
-846.0 milles
19.12%
1 janv. 1994
-5.886 mln.
-616.0 milles
11.69%
1 janv. 1995
-5.886 mln.
0.0
0.0%
1 janv. 1996
-5.886 mln.
0.0
0.0%
1 janv. 1997
-5.886 mln.
0.0
0.0%
1 janv. 1998
-5.886 mln.
0.0
0.0%
1 janv. 1999
-5.886 mln.
0.0
0.0%
1 janv. 2000
-5.886 mln.
0.0
0.0%
1 janv. 2001
-5.886 mln.
0.0
0.0%
1 janv. 2002
-5.886 mln.
0.0
0.0%
1 janv. 2003
-5.886 mln.
0.0
0.0%
1 janv. 2004
-5.886 mln.
0.0
0.0%
1 janv. 2005
-5.886 mln.
0.0
0.0%
1 janv. 2006
-5.886 mln.
0.0
0.0%
1 janv. 2007
-5.886 mln.
0.0
0.0%
1 janv. 2008
-5.886 mln.
0.0
0.0%
1 janv. 2009
-5.886 mln.
0.0
0.0%
1 janv. 2010
-5.886 mln.
0.0
0.0%
1 janv. 2011
-5.886 mln.
0.0
0.0%
1 janv. 2012
-5.886 mln.
0.0
0.0%
1 janv. 2013
-5.883 mln.
+3.0 milles
-0.05%
1 janv. 2014
-4.926 mln.
+957.0 milles
-16.27%
1 janv. 2015
-4.402 mln.
+524.0 milles
-10.64%
1 janv. 2016
-3.518 mln.
+884.0 milles
-20.08%
Classement des pays selon les statistiques actuelles par années


Commentaires: