29
/fr/
fr
AIzaSyAYiBZKx7MnpbEhh9jyipgxe19OcubqV5w
April 1, 2024
36835
IBRD only
IBD
false
2
1
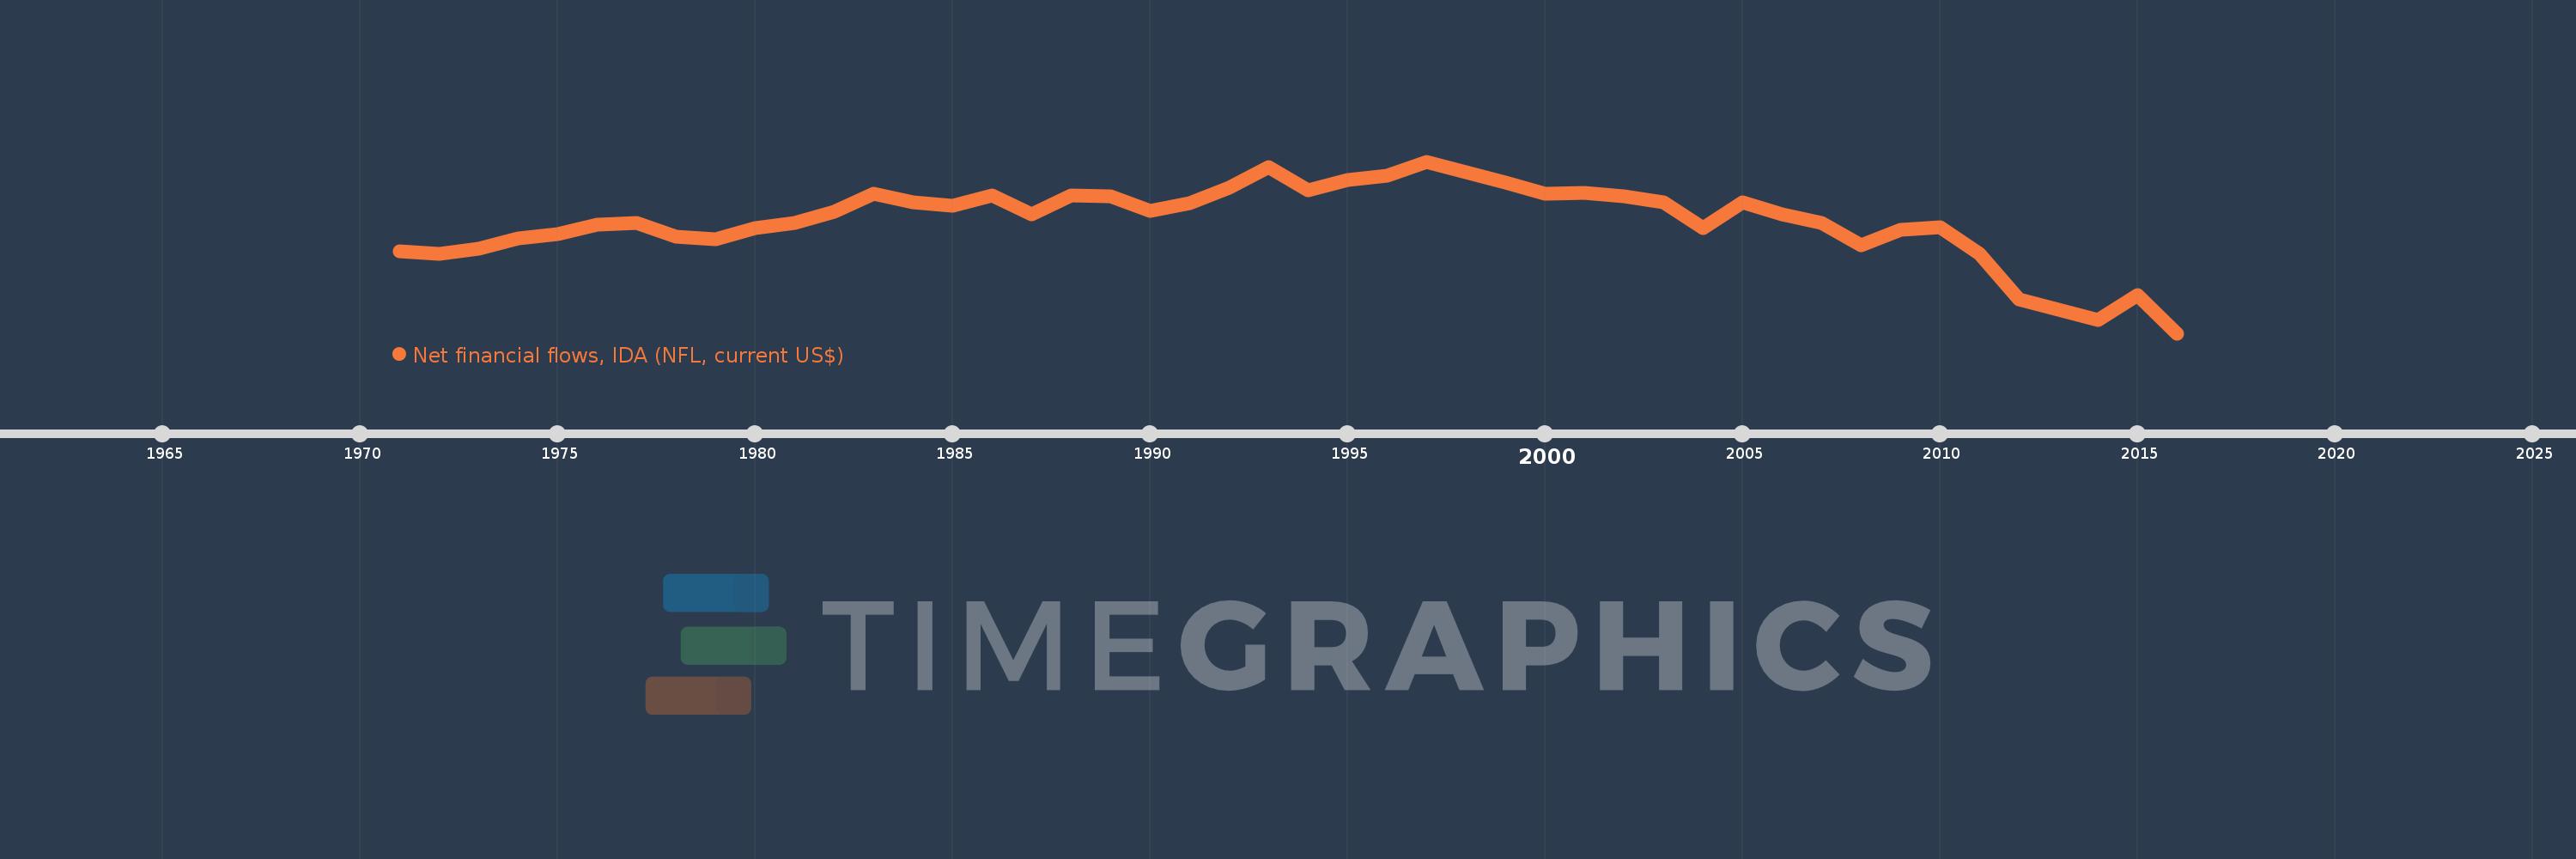
Net financial flows, IDA (NFL, current US$)
2016,2015,2014,2013,2012,2011,2010,2009,2008,2007,2006,2005,2004,2003,2002,2001,2000,1999,1998,1997,1996,1995,1994,1993,1992,1991,1990,1989,1988,1987,1986,1985,1984,1983,1982,1981,1980,1979,1978,1977,1976,1975,1974,1973,1972,1971
Cette statistique dans les autres pays:
La ligne de temps
Cette échelle de temps montre un graphique de 1971 année à 2016 année IBRD only. Les données jusqu'à 1970 année ne sont pas présentés. Quantité d'observations actuelles selon dates: 46.
Source (désignation):
Les indicateurs du développement mondiale
Source (organisation):
World Bank, International Debt Statistics.
Catégories:
External Debt
Dernière mise à jour
23 avr. 2017
Les indicateurs de changement de valeurs selon les années
Minimum:
-1.386 mds
1 janv. 2016
Maximum:
1.927 mds
1 janv. 1997
Pour la date d''observation
Valeur
Changement absolu
Le changement par rapport à la valeur précédente
1 janv. 1971
194.159 mln.
+194.159 mln.
0.0%
1 janv. 1972
152.845 mln.
-41.314 mln.
-21.28%
1 janv. 1973
251.452 mln.
+98.607 mln.
64.51%
1 janv. 1974
436.715 mln.
+185.263 mln.
73.68%
1 janv. 1975
532.32 mln.
+95.605 mln.
21.89%
1 janv. 1976
706.832 mln.
+174.512 mln.
32.78%
1 janv. 1977
735.324 mln.
+28.492 mln.
4.03%
1 janv. 1978
474.587 mln.
-260.737 mln.
-35.46%
1 janv. 1979
428.655 mln.
-45.932 mln.
-9.68%
1 janv. 1980
645.503 mln.
+216.848 mln.
50.59%
1 janv. 1981
740.029 mln.
+94.526 mln.
14.64%
1 janv. 1982
953.438 mln.
+213.409 mln.
28.84%
1 janv. 1983
1.308 mds
+354.127 mln.
37.14%
1 janv. 1984
1.136 mds
-171.765 mln.
-13.14%
1 janv. 1985
1.073 mds
-62.317 mln.
-5.49%
1 janv. 1986
1.278 mds
+204.534 mln.
19.05%
1 janv. 1987
914.618 mln.
-363.399 mln.
-28.43%
1 janv. 1988
1.273 mds
+358.332 mln.
39.18%
1 janv. 1989
1.249 mds
-24.021 mln.
-1.89%
1 janv. 1990
972.46 mln.
-276.469 mln.
-22.14%
1 janv. 1991
1.12 mds
+147.157 mln.
15.13%
1 janv. 1992
1.423 mds
+303.365 mln.
27.1%
1 janv. 1993
1.817 mds
+394.482 mln.
27.72%
1 janv. 1994
1.374 mds
-443.472 mln.
-24.4%
1 janv. 1995
1.563 mds
+188.89 mln.
13.75%
1 janv. 1996
1.66 mds
+96.711 mln.
6.19%
1 janv. 1997
1.927 mds
+267.415 mln.
16.11%
1 janv. 1998
1.715 mds
-212.375 mln.
-11.02%
1 janv. 1999
1.516 mds
-198.596 mln.
-11.58%
1 janv. 2000
1.314 mds
-202.518 mln.
-13.36%
1 janv. 2001
1.316 mds
+2.783 mln.
0.21%
1 janv. 2002
1.251 mds
-64.818 mln.
-4.92%
1 janv. 2003
1.133 mds
-117.984 mln.
-9.43%
1 janv. 2004
648.077 mln.
-485.423 mln.
-42.83%
1 janv. 2005
1.148 mds
+500.087 mln.
77.16%
1 janv. 2006
904.782 mln.
-243.382 mln.
-21.2%
1 janv. 2007
736.802 mln.
-167.98 mln.
-18.57%
1 janv. 2008
315.762 mln.
-421.04 mln.
-57.14%
1 janv. 2009
601.935 mln.
+286.173 mln.
90.63%
1 janv. 2010
656.563 mln.
+54.628 mln.
9.08%
1 janv. 2011
152.617 mln.
-503.946 mln.
-76.76%
1 janv. 2012
-729.271 mln.
-881.888 mln.
-577.84%
1 janv. 2013
-931.841 mln.
-202.57 mln.
27.78%
1 janv. 2014
-1.124 mds
-192.497 mln.
20.66%
1 janv. 2015
-655.354 mln.
+468.984 mln.
-41.71%
1 janv. 2016
-1.386 mds
-730.485 mln.
111.46%
Classement des pays selon les statistiques actuelles par années


Commentaires: