29
/fr/
fr
AIzaSyAYiBZKx7MnpbEhh9jyipgxe19OcubqV5w
April 1, 2024
71218
Armenia
ARM
true
2
1
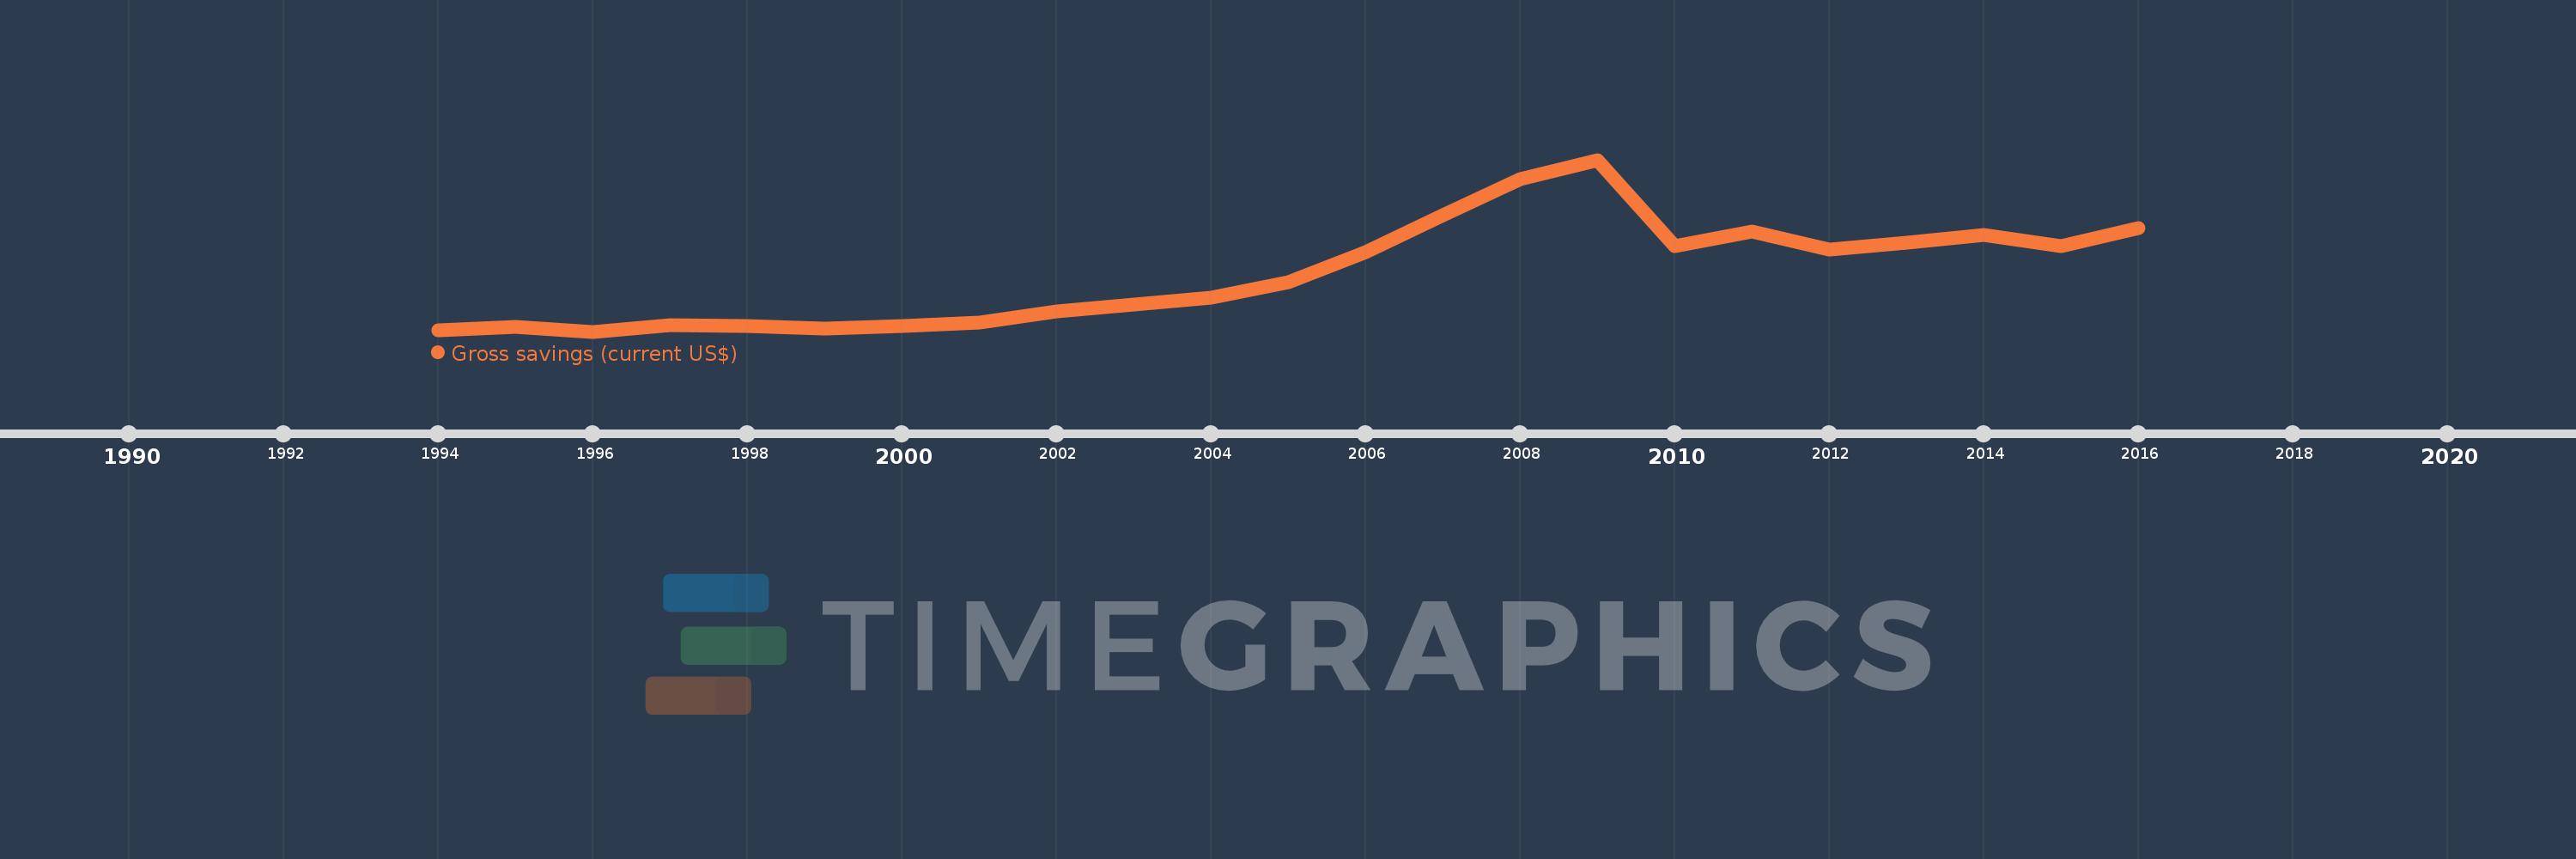
Gross savings (current US$)
2016,2015,2014,2013,2012,2011,2010,2009,2008,2007,2006,2005,2004,2003,2002,2001,2000,1999,1998,1997,1996,1995,1994
Cette statistique dans les autres pays:
AfghanistanAlbaniaAlgeriaAngolaAntigua and BarbudaArgentinaArmeniaAustraliaAustriaAzerbaijanBahamas, TheBahrainBangladeshBarbadosBelarusBelgiumBelizeBeninBermudaBhutanBoliviaBosnia and HerzegovinaBotswanaBrazilBrunei DarussalamBulgariaBurkina FasoBurundiCabo VerdeCambodiaCameroonCanadaCentral African RepublicChadChileChinaColombiaComorosCongo, Dem. Rep.Congo, Rep.Costa RicaCote d'IvoireCroatiaCyprusCzech RepublicDenmarkDjiboutiDominicaDominican RepublicEcuadorEgypt, Arab Rep.El SalvadorEquatorial GuineaEritreaEstoniaEthiopiaFaroe IslandsFijiFinlandFranceGabonGambia, TheGeorgiaGermanyGhanaGreeceGrenadaGuatemalaGuineaGuinea-BissauGuyanaHaitiHondurasHong Kong SAR, ChinaHungaryIcelandIndiaIndonesiaIran, Islamic Rep.IraqIrelandIsraelItalyJamaicaJapanJordanKazakhstanKenyaKiribatiKorea, Rep.KosovoKuwaitKyrgyz RepublicLao PDRLatviaLebanonLesothoLiberiaLibyaLithuaniaLuxembourgMacao SAR, ChinaMacedonia, FYRMadagascarMalawiMalaysiaMaldivesMaliMaltaMauritaniaMauritiusMexicoMoldovaMongoliaMontenegroMoroccoMozambiqueNamibiaNepalNetherlandsNew ZealandNicaraguaNigerNigeriaNorwayOmanPakistanPanamaPapua New GuineaParaguayPeruPhilippinesPolandPortugalQatarRomaniaRussian FederationRwandaSaudi ArabiaSenegalSerbiaSeychellesSierra LeoneSingaporeSlovak RepublicSloveniaSolomon IslandsSouth AfricaSouth SudanSpainSri LankaSt. Kitts and NevisSt. LuciaSt. Vincent and the GrenadinesSudanSurinameSwazilandSwedenSwitzerlandSyrian Arab RepublicTajikistanTanzaniaThailandTimor-LesteTogoTongaTrinidad and TobagoTunisiaTurkeyUgandaUkraineUnited KingdomUnited StatesUruguayVanuatuVenezuela, RBVietnamWest Bank and GazaYemen, Rep.ZambiaZimbabwe La ligne de temps
Cette échelle de temps montre un graphique de 1994 année à 2016 année Armenia. Les données jusqu'à 1993 année ne sont pas présentés. Quantité d'observations actuelles selon dates: 23.
Source (désignation):
Les indicateurs du développement mondiale
Source (organisation):
World Bank national accounts data, and OECD National Accounts data files.
Catégories:
Economy & Growth
Dernière mise à jour
23 avr. 2017
Les indicateurs de changement de valeurs selon les années
Minimum:
-107.654 mln.
1 janv. 1996
Maximum:
3.249 mds
1 janv. 2009
Pour la date d''observation
Valeur
Changement absolu
Le changement par rapport à la valeur précédente
1 janv. 1994
-79.61 mln.
-79.61 mln.
0.0%
1 janv. 1995
-21.807 mln.
+57.803 mln.
-72.61%
1 janv. 1996
-107.654 mln.
-85.846 mln.
393.66%
1 janv. 1997
11.118 mln.
+118.772 mln.
-110.33%
1 janv. 1998
-3.292 mln.
-14.41 mln.
-129.61%
1 janv. 1999
-51.324 mln.
-48.033 mln.
1.46 milles%
1 janv. 2000
7.691 mln.
+59.015 mln.
-114.98%
1 janv. 2001
61.087 mln.
+53.396 mln.
694.3%
1 janv. 2002
281.409 mln.
+220.322 mln.
360.67%
1 janv. 2003
422.92 mln.
+141.512 mln.
50.29%
1 janv. 2004
555.0 mln.
+132.08 mln.
31.23%
1 janv. 2005
858.423 mln.
+303.423 mln.
54.67%
1 janv. 2006
1.445 mds
+586.592 mln.
68.33%
1 janv. 2007
2.16 mds
+715.15 mln.
49.49%
1 janv. 2008
2.87 mds
+709.732 mln.
32.86%
1 janv. 2009
3.249 mds
+378.621 mln.
13.19%
1 janv. 2010
1.558 mds
-1.69 mds
-52.03%
1 janv. 2011
1.841 mds
+283.043 mln.
18.16%
1 janv. 2012
1.49 mds
-350.905 mln.
-19.06%
1 janv. 2013
1.633 mds
+142.566 mln.
9.57%
1 janv. 2014
1.777 mds
+144.408 mln.
8.84%
1 janv. 2015
1.563 mds
-214.576 mln.
-12.07%
1 janv. 2016
1.909 mds
+346.737 mln.
22.19%
Classement des pays selon les statistiques actuelles par années


Commentaires: