29
/fr/
fr
AIzaSyAYiBZKx7MnpbEhh9jyipgxe19OcubqV5w
April 1, 2024
111015
Congo, Rep.
COG
true
2
1
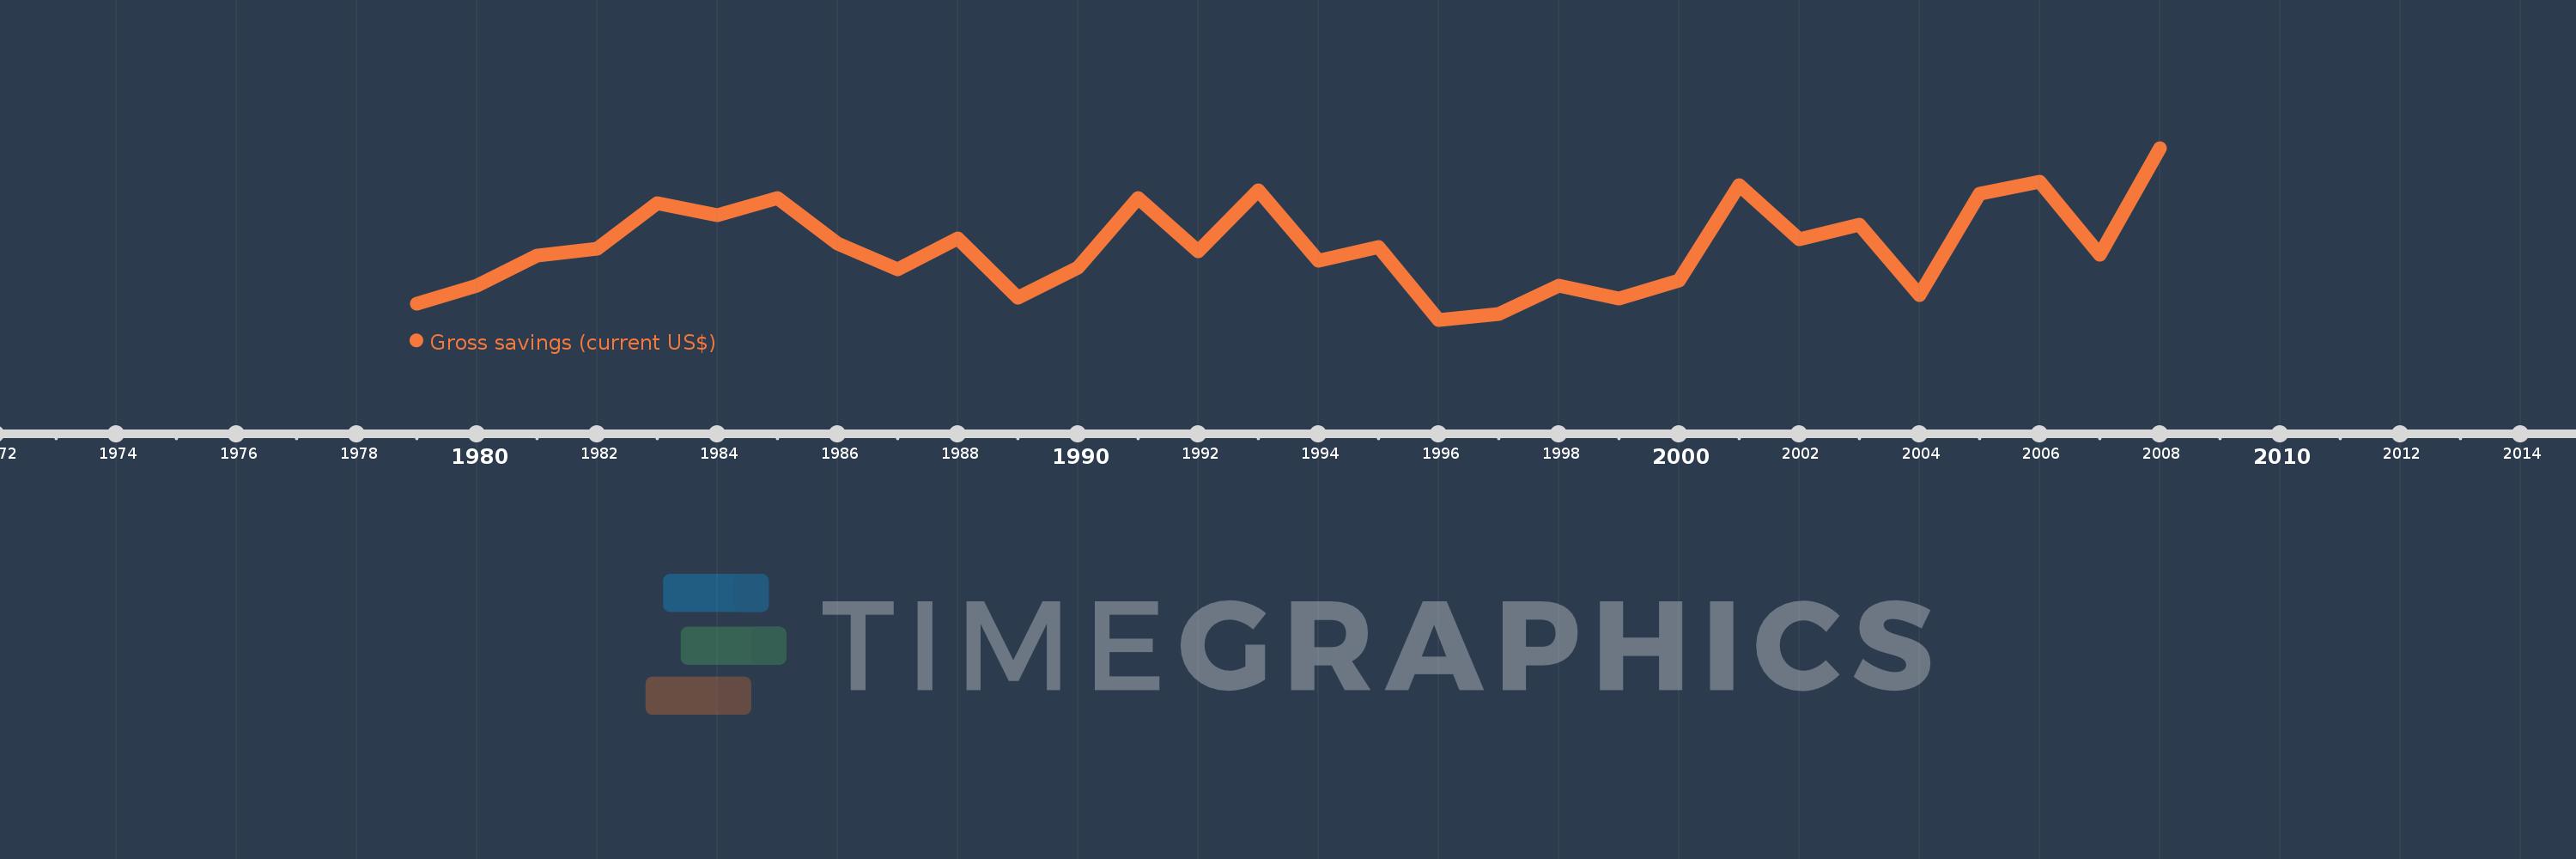
Gross savings (current US$)
2008,2007,2006,2005,2004,2003,2002,2001,2000,1999,1998,1997,1996,1995,1994,1993,1992,1991,1990,1989,1988,1987,1986,1985,1984,1983,1982,1981,1980,1979
Cette statistique dans les autres pays:
AfghanistanAlbaniaAlgeriaAngolaAntigua and BarbudaArgentinaArmeniaAustraliaAustriaAzerbaijanBahamas, TheBahrainBangladeshBarbadosBelarusBelgiumBelizeBeninBermudaBhutanBoliviaBosnia and HerzegovinaBotswanaBrazilBrunei DarussalamBulgariaBurkina FasoBurundiCabo VerdeCambodiaCameroonCanadaCentral African RepublicChadChileChinaColombiaComorosCongo, Dem. Rep.Congo, Rep.Costa RicaCote d'IvoireCroatiaCyprusCzech RepublicDenmarkDjiboutiDominicaDominican RepublicEcuadorEgypt, Arab Rep.El SalvadorEquatorial GuineaEritreaEstoniaEthiopiaFaroe IslandsFijiFinlandFranceGabonGambia, TheGeorgiaGermanyGhanaGreeceGrenadaGuatemalaGuineaGuinea-BissauGuyanaHaitiHondurasHong Kong SAR, ChinaHungaryIcelandIndiaIndonesiaIran, Islamic Rep.IraqIrelandIsraelItalyJamaicaJapanJordanKazakhstanKenyaKiribatiKorea, Rep.KosovoKuwaitKyrgyz RepublicLao PDRLatviaLebanonLesothoLiberiaLibyaLithuaniaLuxembourgMacao SAR, ChinaMacedonia, FYRMadagascarMalawiMalaysiaMaldivesMaliMaltaMauritaniaMauritiusMexicoMoldovaMongoliaMontenegroMoroccoMozambiqueNamibiaNepalNetherlandsNew ZealandNicaraguaNigerNigeriaNorwayOmanPakistanPanamaPapua New GuineaParaguayPeruPhilippinesPolandPortugalQatarRomaniaRussian FederationRwandaSaudi ArabiaSenegalSerbiaSeychellesSierra LeoneSingaporeSlovak RepublicSloveniaSolomon IslandsSouth AfricaSouth SudanSpainSri LankaSt. Kitts and NevisSt. LuciaSt. Vincent and the GrenadinesSudanSurinameSwazilandSwedenSwitzerlandSyrian Arab RepublicTajikistanTanzaniaThailandTimor-LesteTogoTongaTrinidad and TobagoTunisiaTurkeyUgandaUkraineUnited KingdomUnited StatesUruguayVanuatuVenezuela, RBVietnamWest Bank and GazaYemen, Rep.ZambiaZimbabwe La ligne de temps
Cette échelle de temps montre un graphique de 1979 année à 2008 année Congo, Rep.. Les données jusqu'à 1978 année ne sont pas présentés. Quantité d'observations actuelles selon dates: 30.
Source (désignation):
Les indicateurs du développement mondiale
Source (organisation):
World Bank national accounts data, and OECD National Accounts data files.
Catégories:
Economy & Growth
Dernière mise à jour
23 avr. 2017
Les indicateurs de changement de valeurs selon les années
Minimum:
-48.863 mln.
1 janv. 1996
Maximum:
1.272 mds
1 janv. 2008
Pour la date d''observation
Valeur
Changement absolu
Le changement par rapport à la valeur précédente
1 janv. 1979
71.443 mln.
+71.443 mln.
0.0%
1 janv. 1980
214.698 mln.
+143.254 mln.
200.51%
1 janv. 1981
445.571 mln.
+230.873 mln.
107.53%
1 janv. 1982
499.321 mln.
+53.75 mln.
12.06%
1 janv. 1983
848.064 mln.
+348.744 mln.
69.84%
1 janv. 1984
757.832 mln.
-90.232 mln.
-10.64%
1 janv. 1985
888.127 mln.
+130.295 mln.
17.19%
1 janv. 1986
537.481 mln.
-350.646 mln.
-39.48%
1 janv. 1987
339.34 mln.
-198.141 mln.
-36.86%
1 janv. 1988
574.345 mln.
+235.005 mln.
69.25%
1 janv. 1989
118.41 mln.
-455.935 mln.
-79.38%
1 janv. 1990
348.869 mln.
+230.459 mln.
194.63%
1 janv. 1991
889.368 mln.
+540.499 mln.
154.93%
1 janv. 1992
478.985 mln.
-410.382 mln.
-46.14%
1 janv. 1993
948.373 mln.
+469.387 mln.
98.0%
1 janv. 1994
404.524 mln.
-543.848 mln.
-57.35%
1 janv. 1995
509.718 mln.
+105.194 mln.
26.0%
1 janv. 1996
-48.863 mln.
-558.581 mln.
-109.59%
1 janv. 1997
-5.269 mln.
+43.594 mln.
-89.22%
1 janv. 1998
215.395 mln.
+220.665 mln.
-4.19 milles%
1 janv. 1999
117.516 mln.
-97.879 mln.
-45.44%
1 janv. 2000
249.848 mln.
+132.331 mln.
112.61%
1 janv. 2001
983.862 mln.
+734.015 mln.
293.78%
1 janv. 2002
568.327 mln.
-415.535 mln.
-42.24%
1 janv. 2003
683.23 mln.
+114.903 mln.
20.22%
1 janv. 2004
143.373 mln.
-539.857 mln.
-79.02%
1 janv. 2005
918.603 mln.
+775.23 mln.
540.71%
1 janv. 2006
1.01 mds
+90.961 mln.
9.9%
1 janv. 2007
454.328 mln.
-555.236 mln.
-55.0%
1 janv. 2008
1.272 mds
+817.601 mln.
179.96%
Classement des pays selon les statistiques actuelles par années


Commentaires: