29
/fr/
fr
AIzaSyAYiBZKx7MnpbEhh9jyipgxe19OcubqV5w
April 1, 2024
243665
Solomon Islands
SLB
true
2
1
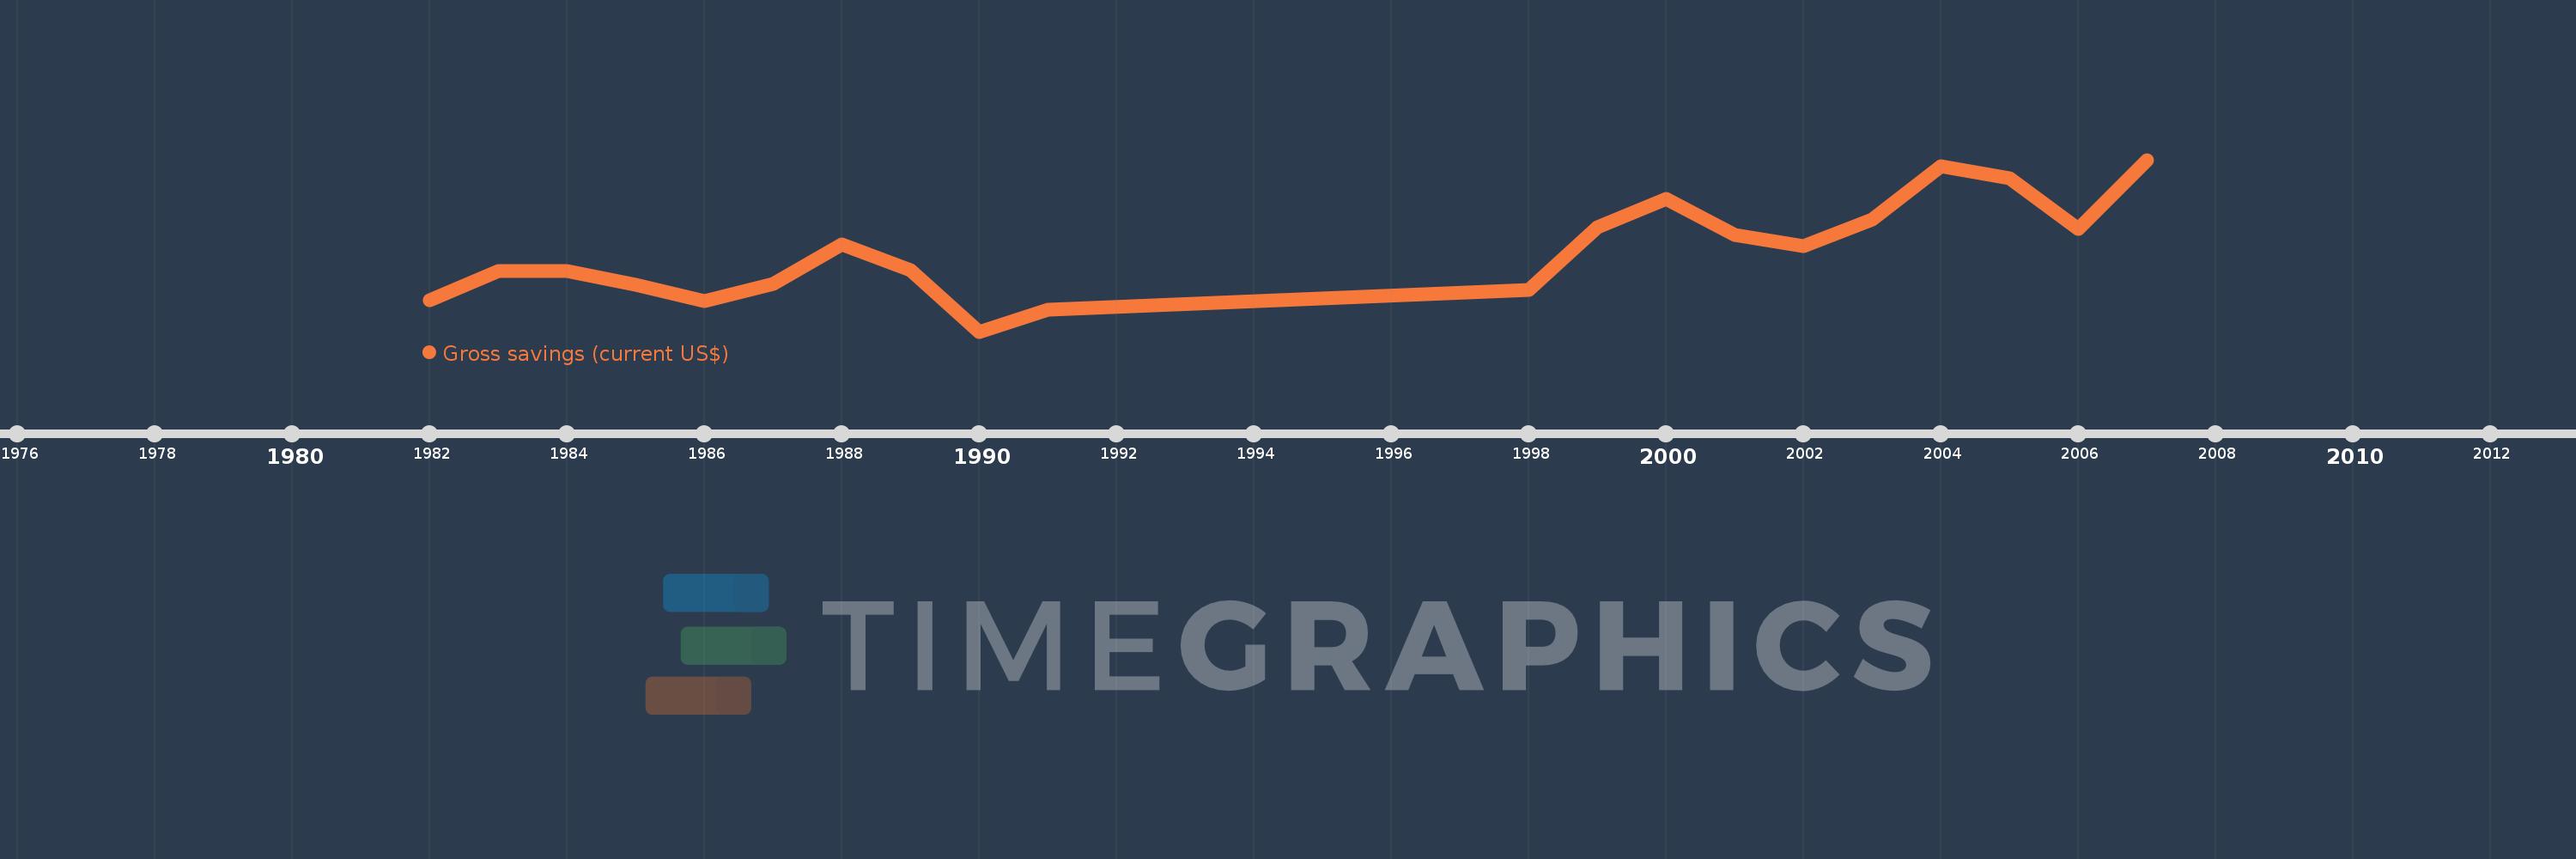
Gross savings (current US$)
2007,2006,2005,2004,2003,2002,2001,2000,1999,1998,1991,1990,1989,1988,1987,1986,1985,1984,1983,1982
Cette statistique dans les autres pays:
AfghanistanAlbaniaAlgeriaAngolaAntigua and BarbudaArgentinaArmeniaAustraliaAustriaAzerbaijanBahamas, TheBahrainBangladeshBarbadosBelarusBelgiumBelizeBeninBermudaBhutanBoliviaBosnia and HerzegovinaBotswanaBrazilBrunei DarussalamBulgariaBurkina FasoBurundiCabo VerdeCambodiaCameroonCanadaCentral African RepublicChadChileChinaColombiaComorosCongo, Dem. Rep.Congo, Rep.Costa RicaCote d'IvoireCroatiaCyprusCzech RepublicDenmarkDjiboutiDominicaDominican RepublicEcuadorEgypt, Arab Rep.El SalvadorEquatorial GuineaEritreaEstoniaEthiopiaFaroe IslandsFijiFinlandFranceGabonGambia, TheGeorgiaGermanyGhanaGreeceGrenadaGuatemalaGuineaGuinea-BissauGuyanaHaitiHondurasHong Kong SAR, ChinaHungaryIcelandIndiaIndonesiaIran, Islamic Rep.IraqIrelandIsraelItalyJamaicaJapanJordanKazakhstanKenyaKiribatiKorea, Rep.KosovoKuwaitKyrgyz RepublicLao PDRLatviaLebanonLesothoLiberiaLibyaLithuaniaLuxembourgMacao SAR, ChinaMacedonia, FYRMadagascarMalawiMalaysiaMaldivesMaliMaltaMauritaniaMauritiusMexicoMoldovaMongoliaMontenegroMoroccoMozambiqueNamibiaNepalNetherlandsNew ZealandNicaraguaNigerNigeriaNorwayOmanPakistanPanamaPapua New GuineaParaguayPeruPhilippinesPolandPortugalQatarRomaniaRussian FederationRwandaSaudi ArabiaSenegalSerbiaSeychellesSierra LeoneSingaporeSlovak RepublicSloveniaSolomon IslandsSouth AfricaSouth SudanSpainSri LankaSt. Kitts and NevisSt. LuciaSt. Vincent and the GrenadinesSudanSurinameSwazilandSwedenSwitzerlandSyrian Arab RepublicTajikistanTanzaniaThailandTimor-LesteTogoTongaTrinidad and TobagoTunisiaTurkeyUgandaUkraineUnited KingdomUnited StatesUruguayVanuatuVenezuela, RBVietnamWest Bank and GazaYemen, Rep.ZambiaZimbabwe La ligne de temps
Cette échelle de temps montre un graphique de 1982 année à 2007 année Solomon Islands. Les données jusqu'à 1981 année ne sont pas présentés. Quantité d'observations actuelles selon dates: 20.
Source (désignation):
Les indicateurs du développement mondiale
Source (organisation):
World Bank national accounts data, and OECD National Accounts data files.
Catégories:
Economy & Growth
Dernière mise à jour
23 avr. 2017
Les indicateurs de changement de valeurs selon les années
Minimum:
-122.45 mln.
1 janv. 1990
Maximum:
47.003 mln.
1 janv. 2007
Pour la date d''observation
Valeur
Changement absolu
Le changement par rapport à la valeur précédente
1 janv. 1982
-91.243 mln.
-91.243 mln.
0.0%
1 janv. 1983
-63.124 mln.
+28.119 mln.
-30.82%
1 janv. 1984
-62.685 mln.
+439.8 milles
-0.7%
1 janv. 1985
-76.549 mln.
-13.864 mln.
22.12%
1 janv. 1986
-92.652 mln.
-16.104 mln.
21.04%
1 janv. 1987
-75.395 mln.
+17.258 mln.
-18.63%
1 janv. 1988
-36.639 mln.
+38.755 mln.
-51.4%
1 janv. 1989
-61.945 mln.
-25.306 mln.
69.07%
1 janv. 1990
-122.45 mln.
-60.505 mln.
97.67%
1 janv. 1991
-100.601 mln.
+21.849 mln.
-17.84%
1 janv. 1998
-81.694 mln.
+18.906 mln.
-18.79%
1 janv. 1999
-19.494 mln.
+62.201 mln.
-76.14%
1 janv. 2000
8.193 mln.
+27.687 mln.
-142.03%
1 janv. 2001
-27.386 mln.
-35.579 mln.
-434.26%
1 janv. 2002
-38.163 mln.
-10.777 mln.
39.35%
1 janv. 2003
-11.537 mln.
+26.626 mln.
-69.77%
1 janv. 2004
40.343 mln.
+51.88 mln.
-449.67%
1 janv. 2005
28.693 mln.
-11.65 mln.
-28.88%
1 janv. 2006
-21.365 mln.
-50.058 mln.
-174.46%
1 janv. 2007
47.003 mln.
+68.367 mln.
-320.0%
Classement des pays selon les statistiques actuelles par années


Commentaires: