29
/fr/
fr
AIzaSyAYiBZKx7MnpbEhh9jyipgxe19OcubqV5w
April 1, 2024
64790
Albania
ALB
true
2
1
Gross savings (current US$)
2016,2015,2014,2013,2012,2011,2010,2009,2008,2007,2006,2005,2004,2003,2002,2001,2000,1999,1998,1997,1996,1995,1994,1993,1992,1991,1990,1989,1988,1987,1986,1985
Cette statistique dans les autres pays:
AfghanistanAlbaniaAlgeriaAngolaAntigua and BarbudaArgentinaArmeniaAustraliaAustriaAzerbaijanBahamas, TheBahrainBangladeshBarbadosBelarusBelgiumBelizeBeninBermudaBhutanBoliviaBosnia and HerzegovinaBotswanaBrazilBrunei DarussalamBulgariaBurkina FasoBurundiCabo VerdeCambodiaCameroonCanadaCentral African RepublicChadChileChinaColombiaComorosCongo, Dem. Rep.Congo, Rep.Costa RicaCote d'IvoireCroatiaCyprusCzech RepublicDenmarkDjiboutiDominicaDominican RepublicEcuadorEgypt, Arab Rep.El SalvadorEquatorial GuineaEritreaEstoniaEthiopiaFaroe IslandsFijiFinlandFranceGabonGambia, TheGeorgiaGermanyGhanaGreeceGrenadaGuatemalaGuineaGuinea-BissauGuyanaHaitiHondurasHong Kong SAR, ChinaHungaryIcelandIndiaIndonesiaIran, Islamic Rep.IraqIrelandIsraelItalyJamaicaJapanJordanKazakhstanKenyaKiribatiKorea, Rep.KosovoKuwaitKyrgyz RepublicLao PDRLatviaLebanonLesothoLiberiaLibyaLithuaniaLuxembourgMacao SAR, ChinaMacedonia, FYRMadagascarMalawiMalaysiaMaldivesMaliMaltaMauritaniaMauritiusMexicoMoldovaMongoliaMontenegroMoroccoMozambiqueNamibiaNepalNetherlandsNew ZealandNicaraguaNigerNigeriaNorwayOmanPakistanPanamaPapua New GuineaParaguayPeruPhilippinesPolandPortugalQatarRomaniaRussian FederationRwandaSaudi ArabiaSenegalSerbiaSeychellesSierra LeoneSingaporeSlovak RepublicSloveniaSolomon IslandsSouth AfricaSouth SudanSpainSri LankaSt. Kitts and NevisSt. LuciaSt. Vincent and the GrenadinesSudanSurinameSwazilandSwedenSwitzerlandSyrian Arab RepublicTajikistanTanzaniaThailandTimor-LesteTogoTongaTrinidad and TobagoTunisiaTurkeyUgandaUkraineUnited KingdomUnited StatesUruguayVanuatuVenezuela, RBVietnamWest Bank and GazaYemen, Rep.ZambiaZimbabwe La ligne de temps
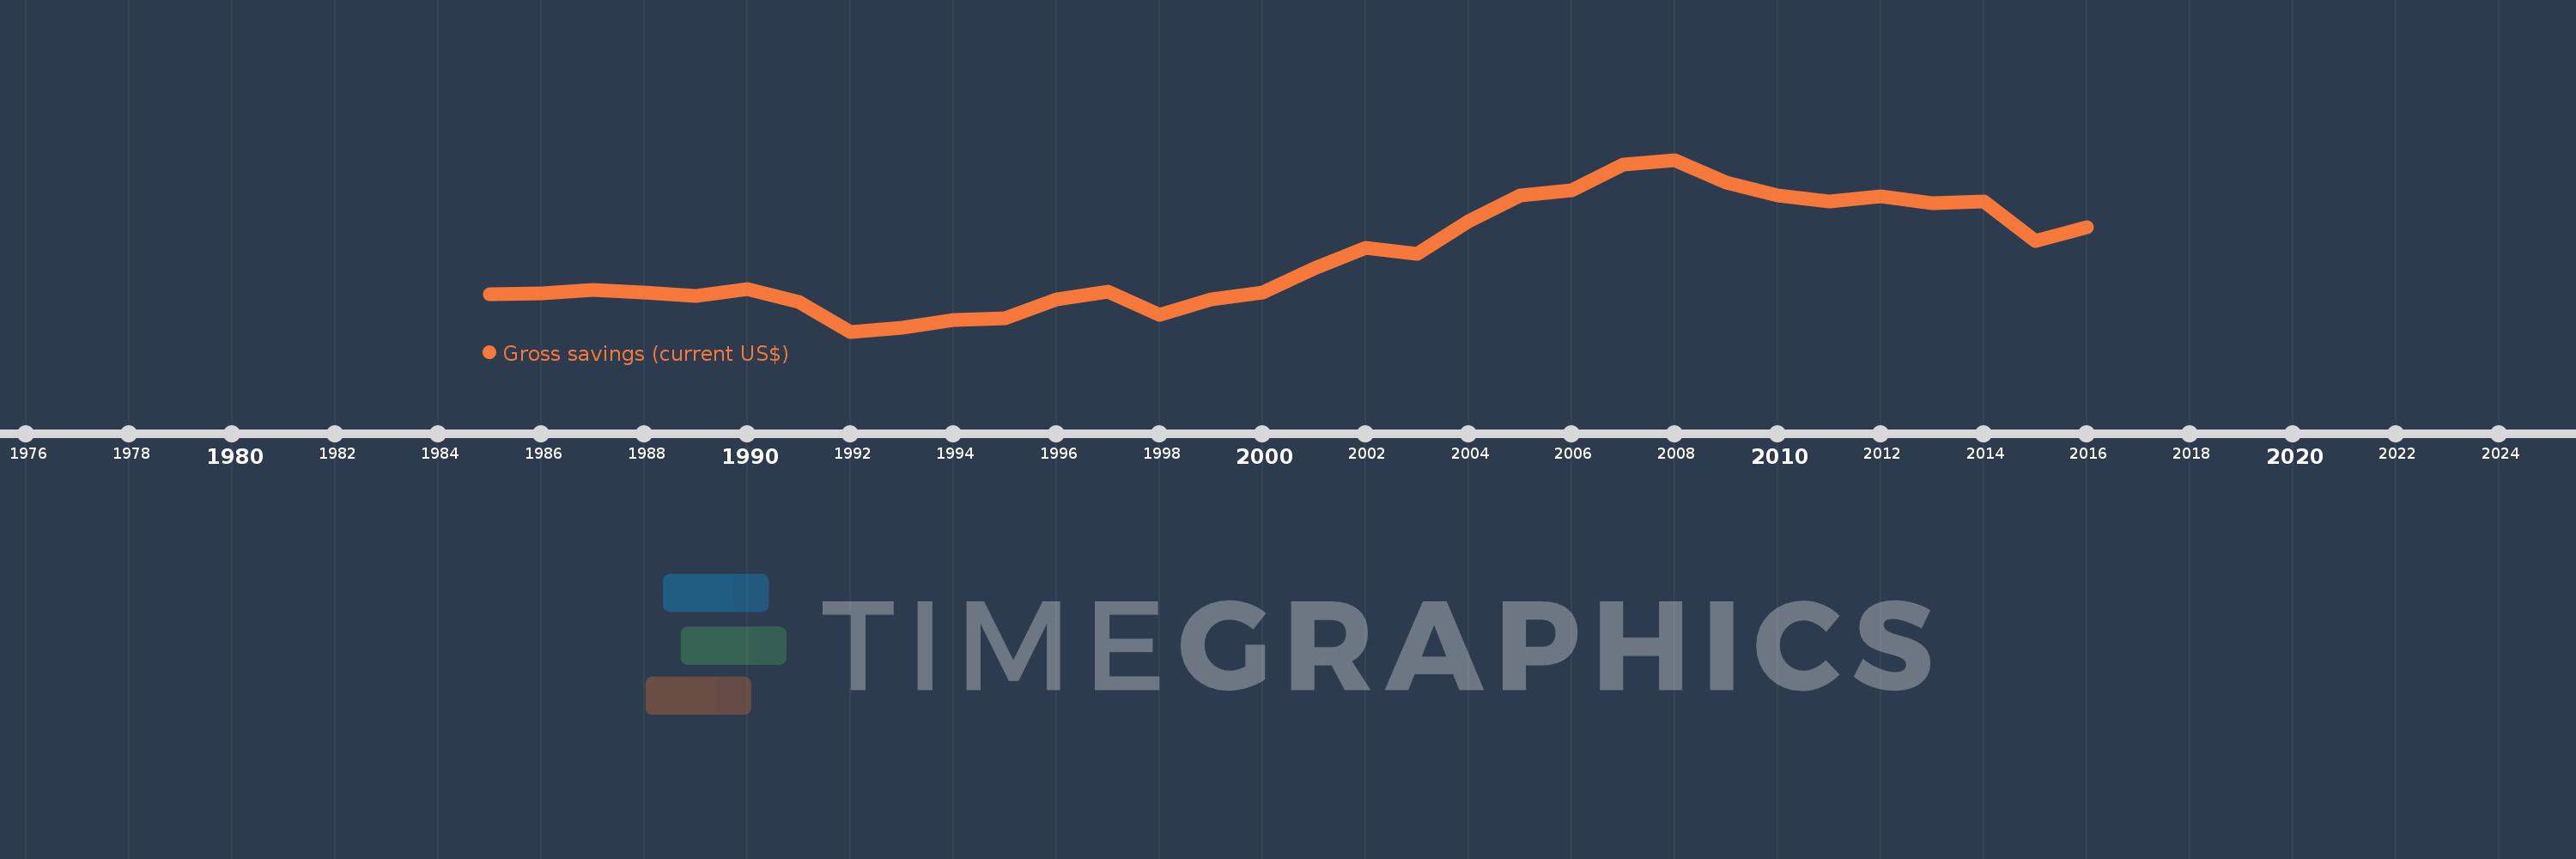
Cette échelle de temps montre un graphique de 1985 année à 2016 année Albania. Les données jusqu'à 1984 année ne sont pas présentés. Quantité d'observations actuelles selon dates: 32.
Source (désignation):
Les indicateurs du développement mondiale
Source (organisation):
World Bank national accounts data, and OECD National Accounts data files.
Catégories:
Economy & Growth
Dernière mise à jour
23 avr. 2017
Les indicateurs de changement de valeurs selon les années
Minimum:
-80.816 mln.
1 janv. 1992
Maximum:
3.008 mds
1 janv. 2008
Pour la date d''observation
Valeur
Changement absolu
Le changement par rapport à la valeur précédente
1 janv. 1985
583.441 mln.
+583.441 mln.
0.0%
1 janv. 1986
607.286 mln.
+23.845 mln.
4.09%
1 janv. 1987
668.763 mln.
+61.476 mln.
10.12%
1 janv. 1988
618.1 mln.
-50.663 mln.
-7.58%
1 janv. 1989
561.412 mln.
-56.688 mln.
-9.17%
1 janv. 1990
686.375 mln.
+124.963 mln.
22.26%
1 janv. 1991
453.988 mln.
-232.387 mln.
-33.86%
1 janv. 1992
-80.816 mln.
-534.804 mln.
-117.8%
1 janv. 1993
-14.629 mln.
+66.187 mln.
-81.9%
1 janv. 1994
129.708 mln.
+144.338 mln.
-986.64%
1 janv. 1995
154.417 mln.
+24.708 mln.
19.05%
1 janv. 1996
495.866 mln.
+341.449 mln.
221.12%
1 janv. 1997
641.199 mln.
+145.333 mln.
29.31%
1 janv. 1998
221.054 mln.
-420.144 mln.
-65.52%
1 janv. 1999
505.678 mln.
+284.623 mln.
128.76%
1 janv. 2000
626.811 mln.
+121.133 mln.
23.95%
1 janv. 2001
1.059 mds
+432.295 mln.
68.97%
1 janv. 2002
1.42 mds
+360.859 mln.
34.07%
1 janv. 2003
1.318 mds
-102.13 mln.
-7.19%
1 janv. 2004
1.903 mds
+585.309 mln.
44.41%
1 janv. 2005
2.365 mds
+461.978 mln.
24.27%
1 janv. 2006
2.464 mds
+98.671 mln.
4.17%
1 janv. 2007
2.916 mds
+451.997 mln.
18.35%
1 janv. 2008
3.008 mds
+91.831 mln.
3.15%
1 janv. 2009
2.595 mds
-412.722 mln.
-13.72%
1 janv. 2010
2.369 mds
-225.907 mln.
-8.71%
1 janv. 2011
2.263 mds
-105.556 mln.
-4.46%
1 janv. 2012
2.346 mds
+82.442 mln.
3.64%
1 janv. 2013
2.234 mds
-112.244 mln.
-4.78%
1 janv. 2014
2.251 mds
+17.711 mln.
0.79%
1 janv. 2015
1.541 mds
-710.271 mln.
-31.55%
1 janv. 2016
1.793 mds
+252.048 mln.
16.36%
Classement des pays selon les statistiques actuelles par années


Commentaires: