29
/fr/
fr
AIzaSyAYiBZKx7MnpbEhh9jyipgxe19OcubqV5w
April 1, 2024
194305
Mauritius
MUS
true
2
1
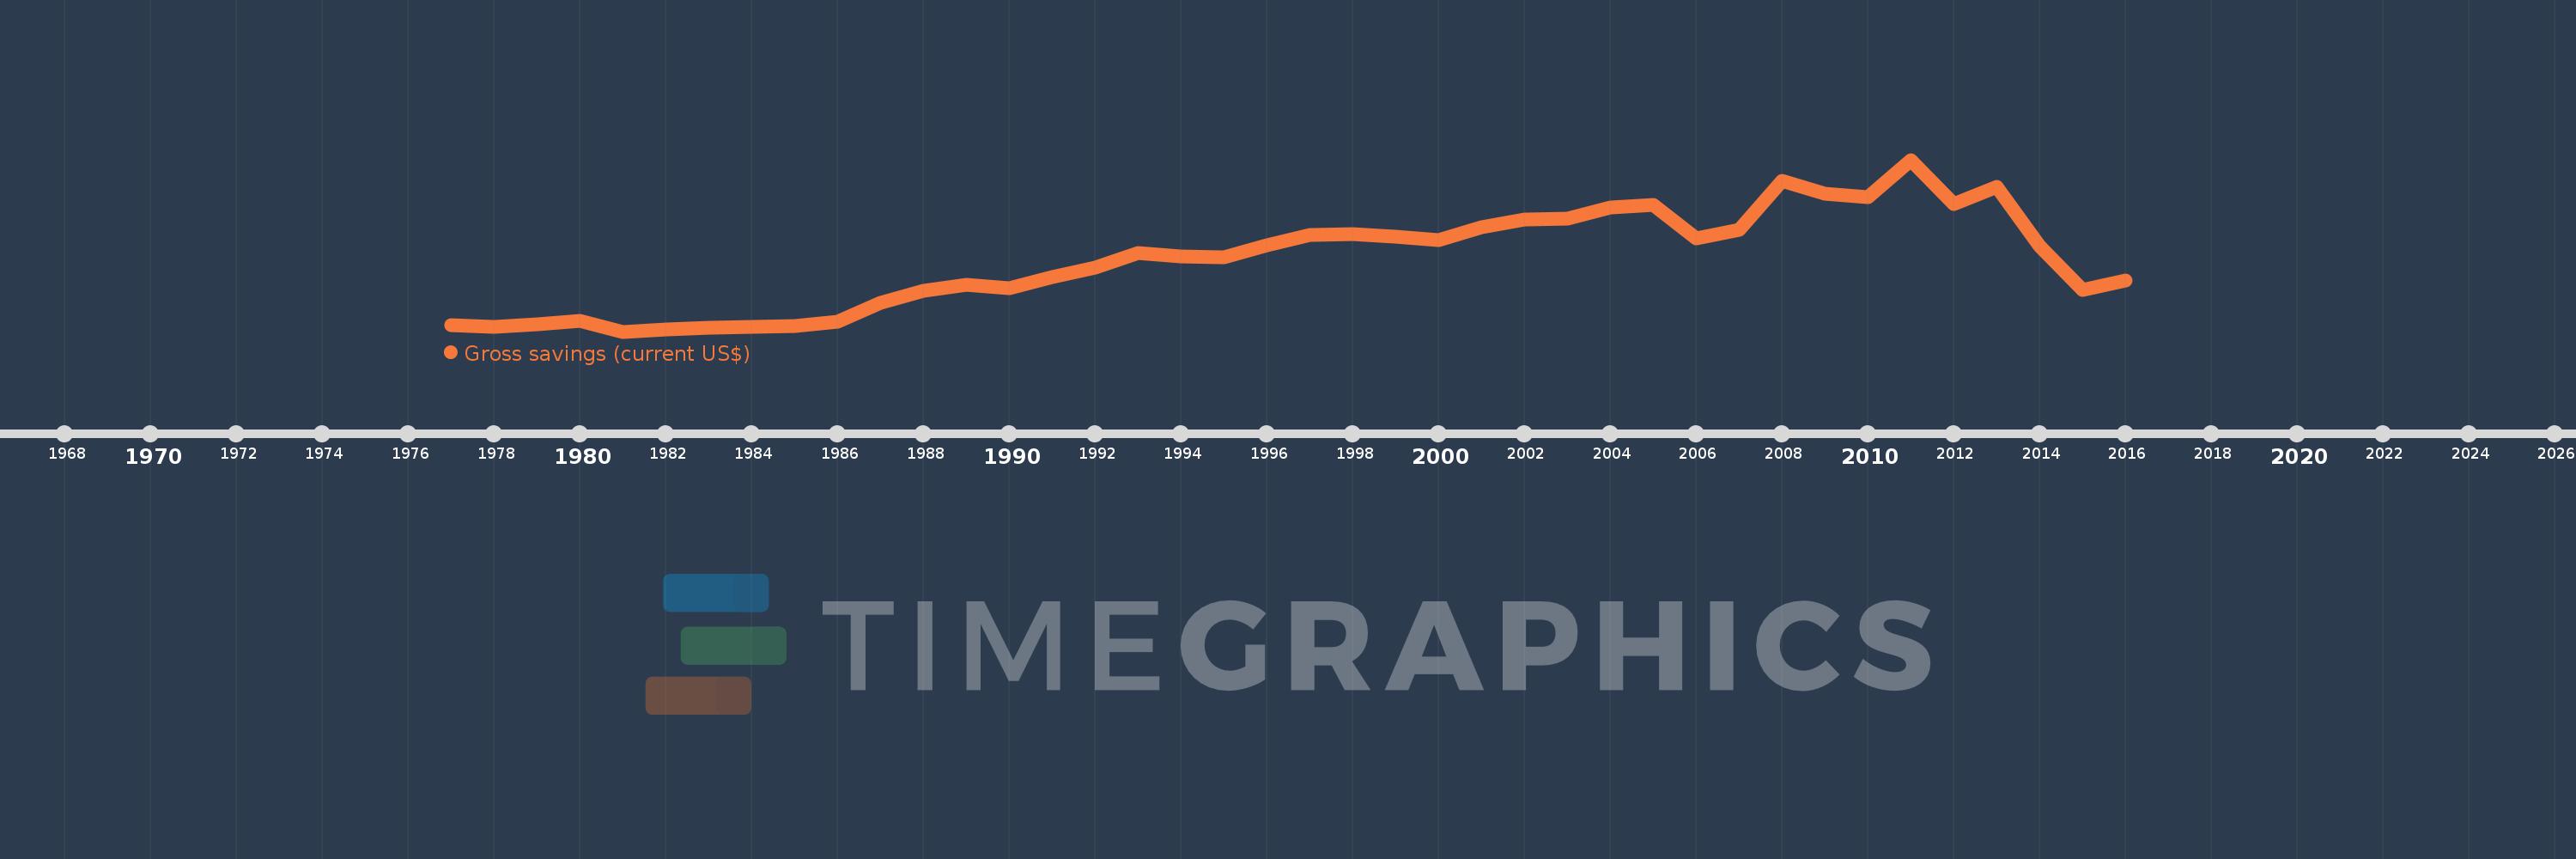
Gross savings (current US$)
2016,2015,2014,2013,2012,2011,2010,2009,2008,2007,2006,2005,2004,2003,2002,2001,2000,1999,1998,1997,1996,1995,1994,1993,1992,1991,1990,1989,1988,1987,1986,1985,1984,1983,1982,1981,1980,1979,1978,1977
Cette statistique dans les autres pays:
AfghanistanAlbaniaAlgeriaAngolaAntigua and BarbudaArgentinaArmeniaAustraliaAustriaAzerbaijanBahamas, TheBahrainBangladeshBarbadosBelarusBelgiumBelizeBeninBermudaBhutanBoliviaBosnia and HerzegovinaBotswanaBrazilBrunei DarussalamBulgariaBurkina FasoBurundiCabo VerdeCambodiaCameroonCanadaCentral African RepublicChadChileChinaColombiaComorosCongo, Dem. Rep.Congo, Rep.Costa RicaCote d'IvoireCroatiaCyprusCzech RepublicDenmarkDjiboutiDominicaDominican RepublicEcuadorEgypt, Arab Rep.El SalvadorEquatorial GuineaEritreaEstoniaEthiopiaFaroe IslandsFijiFinlandFranceGabonGambia, TheGeorgiaGermanyGhanaGreeceGrenadaGuatemalaGuineaGuinea-BissauGuyanaHaitiHondurasHong Kong SAR, ChinaHungaryIcelandIndiaIndonesiaIran, Islamic Rep.IraqIrelandIsraelItalyJamaicaJapanJordanKazakhstanKenyaKiribatiKorea, Rep.KosovoKuwaitKyrgyz RepublicLao PDRLatviaLebanonLesothoLiberiaLibyaLithuaniaLuxembourgMacao SAR, ChinaMacedonia, FYRMadagascarMalawiMalaysiaMaldivesMaliMaltaMauritaniaMauritiusMexicoMoldovaMongoliaMontenegroMoroccoMozambiqueNamibiaNepalNetherlandsNew ZealandNicaraguaNigerNigeriaNorwayOmanPakistanPanamaPapua New GuineaParaguayPeruPhilippinesPolandPortugalQatarRomaniaRussian FederationRwandaSaudi ArabiaSenegalSerbiaSeychellesSierra LeoneSingaporeSlovak RepublicSloveniaSolomon IslandsSouth AfricaSouth SudanSpainSri LankaSt. Kitts and NevisSt. LuciaSt. Vincent and the GrenadinesSudanSurinameSwazilandSwedenSwitzerlandSyrian Arab RepublicTajikistanTanzaniaThailandTimor-LesteTogoTongaTrinidad and TobagoTunisiaTurkeyUgandaUkraineUnited KingdomUnited StatesUruguayVanuatuVenezuela, RBVietnamWest Bank and GazaYemen, Rep.ZambiaZimbabwe La ligne de temps
Cette échelle de temps montre un graphique de 1977 année à 2016 année Mauritius. Les données jusqu'à 1976 année ne sont pas présentés. Quantité d'observations actuelles selon dates: 40.
Source (désignation):
Les indicateurs du développement mondiale
Source (organisation):
World Bank national accounts data, and OECD National Accounts data files.
Catégories:
Economy & Growth
Dernière mise à jour
23 avr. 2017
Les indicateurs de changement de valeurs selon les années
Minimum:
117.773 mln.
1 janv. 1981
Maximum:
1.916 mds
1 janv. 2011
Pour la date d''observation
Valeur
Changement absolu
Le changement par rapport à la valeur précédente
1 janv. 1977
181.396 mln.
+181.396 mln.
0.0%
1 janv. 1978
169.812 mln.
-11.584 mln.
-6.39%
1 janv. 1979
194.376 mln.
+24.564 mln.
14.47%
1 janv. 1980
232.4 mln.
+38.023 mln.
19.56%
1 janv. 1981
117.773 mln.
-114.627 mln.
-49.32%
1 janv. 1982
141.107 mln.
+23.334 mln.
19.81%
1 janv. 1983
154.794 mln.
+13.687 mln.
9.7%
1 janv. 1984
171.277 mln.
+16.483 mln.
10.65%
1 janv. 1985
178.257 mln.
+6.98 mln.
4.08%
1 janv. 1986
223.668 mln.
+45.412 mln.
25.48%
1 janv. 1987
414.959 mln.
+191.29 mln.
85.52%
1 janv. 1988
546.427 mln.
+131.468 mln.
31.68%
1 janv. 1989
605.907 mln.
+59.48 mln.
10.89%
1 janv. 1990
575.483 mln.
-30.424 mln.
-5.02%
1 janv. 1991
685.169 mln.
+109.685 mln.
19.06%
1 janv. 1992
787.929 mln.
+102.76 mln.
15.0%
1 janv. 1993
937.065 mln.
+149.137 mln.
18.93%
1 janv. 1994
904.653 mln.
-32.413 mln.
-3.46%
1 janv. 1995
898.406 mln.
-6.247 mln.
-0.69%
1 janv. 1996
1.018 mds
+119.49 mln.
13.3%
1 janv. 1997
1.133 mds
+114.891 mln.
11.29%
1 janv. 1998
1.136 mds
+3.136 mln.
0.28%
1 janv. 1999
1.109 mds
-27.322 mln.
-2.41%
1 janv. 2000
1.08 mds
-29.007 mln.
-2.62%
1 janv. 2001
1.206 mds
+126.534 mln.
11.72%
1 janv. 2002
1.289 mds
+82.629 mln.
6.85%
1 janv. 2003
1.303 mds
+13.918 mln.
1.08%
1 janv. 2004
1.419 mds
+116.171 mln.
8.92%
1 janv. 2005
1.443 mds
+24.291 mln.
1.71%
1 janv. 2006
1.091 mds
-351.745 mln.
-24.37%
1 janv. 2007
1.185 mds
+93.8 mln.
8.59%
1 janv. 2008
1.696 mds
+510.554 mln.
43.08%
1 janv. 2009
1.56 mds
-135.837 mln.
-8.01%
1 janv. 2010
1.525 mds
-34.774 mln.
-2.23%
1 janv. 2011
1.916 mds
+390.663 mln.
25.61%
1 janv. 2012
1.453 mds
-462.928 mln.
-24.16%
1 janv. 2013
1.636 mds
+183.216 mln.
12.61%
1 janv. 2014
1.011 mds
-625.163 mln.
-38.21%
1 janv. 2015
554.155 mln.
-456.769 mln.
-45.18%
1 janv. 2016
651.175 mln.
+97.019 mln.
17.51%
Classement des pays selon les statistiques actuelles par années


Commentaires: