29
/fr/
fr
AIzaSyAYiBZKx7MnpbEhh9jyipgxe19OcubqV5w
April 1, 2024
249939
St. Kitts and Nevis
KNA
true
2
1
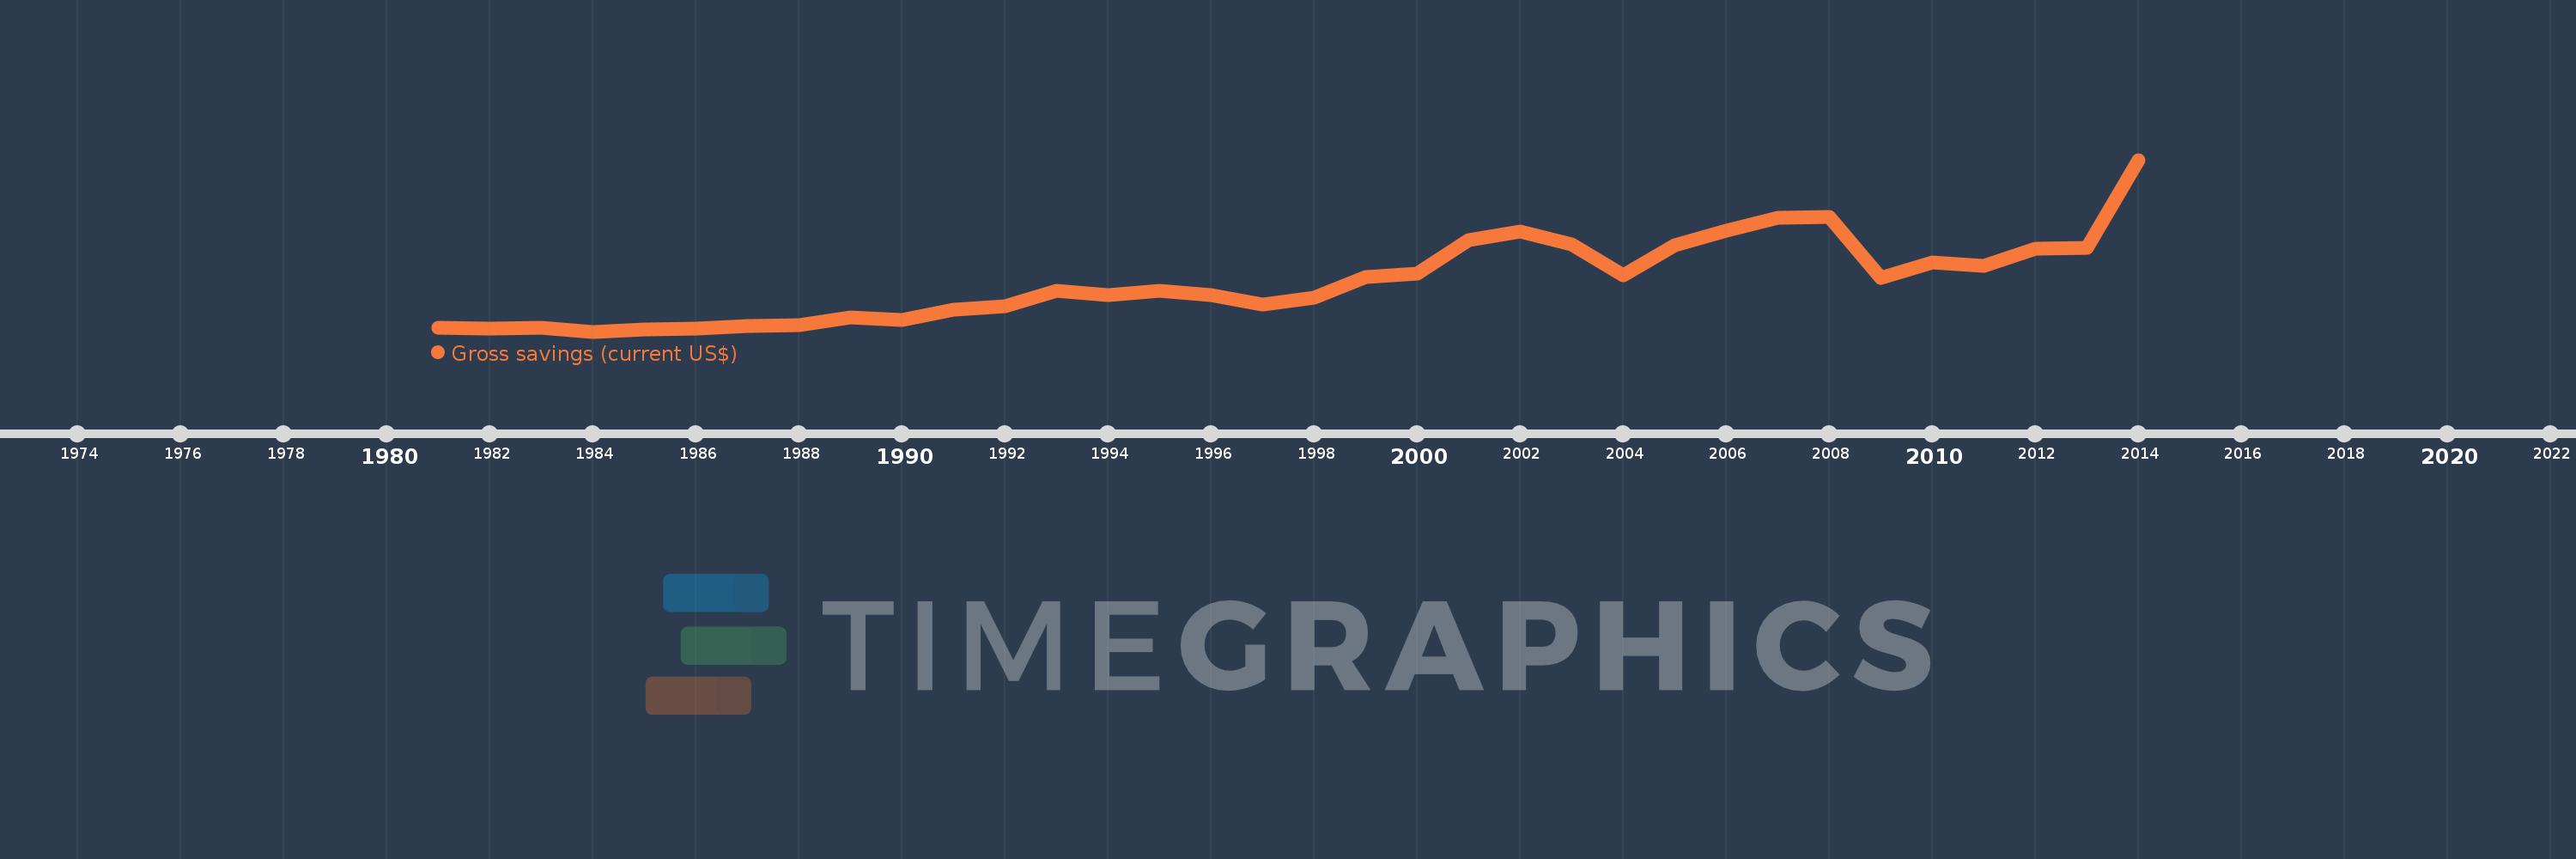
Gross savings (current US$)
2014,2013,2012,2011,2010,2009,2008,2007,2006,2005,2004,2003,2002,2001,2000,1999,1998,1997,1996,1995,1994,1993,1992,1991,1990,1989,1988,1987,1986,1985,1984,1983,1982,1981
Cette statistique dans les autres pays:
AfghanistanAlbaniaAlgeriaAngolaAntigua and BarbudaArgentinaArmeniaAustraliaAustriaAzerbaijanBahamas, TheBahrainBangladeshBarbadosBelarusBelgiumBelizeBeninBermudaBhutanBoliviaBosnia and HerzegovinaBotswanaBrazilBrunei DarussalamBulgariaBurkina FasoBurundiCabo VerdeCambodiaCameroonCanadaCentral African RepublicChadChileChinaColombiaComorosCongo, Dem. Rep.Congo, Rep.Costa RicaCote d'IvoireCroatiaCyprusCzech RepublicDenmarkDjiboutiDominicaDominican RepublicEcuadorEgypt, Arab Rep.El SalvadorEquatorial GuineaEritreaEstoniaEthiopiaFaroe IslandsFijiFinlandFranceGabonGambia, TheGeorgiaGermanyGhanaGreeceGrenadaGuatemalaGuineaGuinea-BissauGuyanaHaitiHondurasHong Kong SAR, ChinaHungaryIcelandIndiaIndonesiaIran, Islamic Rep.IraqIrelandIsraelItalyJamaicaJapanJordanKazakhstanKenyaKiribatiKorea, Rep.KosovoKuwaitKyrgyz RepublicLao PDRLatviaLebanonLesothoLiberiaLibyaLithuaniaLuxembourgMacao SAR, ChinaMacedonia, FYRMadagascarMalawiMalaysiaMaldivesMaliMaltaMauritaniaMauritiusMexicoMoldovaMongoliaMontenegroMoroccoMozambiqueNamibiaNepalNetherlandsNew ZealandNicaraguaNigerNigeriaNorwayOmanPakistanPanamaPapua New GuineaParaguayPeruPhilippinesPolandPortugalQatarRomaniaRussian FederationRwandaSaudi ArabiaSenegalSerbiaSeychellesSierra LeoneSingaporeSlovak RepublicSloveniaSolomon IslandsSouth AfricaSouth SudanSpainSri LankaSt. Kitts and NevisSt. LuciaSt. Vincent and the GrenadinesSudanSurinameSwazilandSwedenSwitzerlandSyrian Arab RepublicTajikistanTanzaniaThailandTimor-LesteTogoTongaTrinidad and TobagoTunisiaTurkeyUgandaUkraineUnited KingdomUnited StatesUruguayVanuatuVenezuela, RBVietnamWest Bank and GazaYemen, Rep.ZambiaZimbabwe La ligne de temps
Cette échelle de temps montre un graphique de 1981 année à 2014 année St. Kitts and Nevis. Les données jusqu'à 1980 année ne sont pas présentés. Quantité d'observations actuelles selon dates: 34.
Source (désignation):
Les indicateurs du développement mondiale
Source (organisation):
World Bank national accounts data, and OECD National Accounts data files.
Catégories:
Economy & Growth
Dernière mise à jour
23 avr. 2017
Les indicateurs de changement de valeurs selon les années
Minimum:
11.356 mln.
1 janv. 1984
Maximum:
272.401 mln.
1 janv. 2014
Pour la date d''observation
Valeur
Changement absolu
Le changement par rapport à la valeur précédente
1 janv. 1981
17.622 mln.
+17.622 mln.
0.0%
1 janv. 1982
16.381 mln.
-1.241 mln.
-7.04%
1 janv. 1983
17.641 mln.
+1.259 mln.
7.69%
1 janv. 1984
11.356 mln.
-6.285 mln.
-35.63%
1 janv. 1985
14.756 mln.
+3.4 mln.
29.94%
1 janv. 1986
16.148 mln.
+1.393 mln.
9.44%
1 janv. 1987
20.485 mln.
+4.337 mln.
26.86%
1 janv. 1988
21.385 mln.
+900.0 milles
4.39%
1 janv. 1989
32.656 mln.
+11.27 mln.
52.7%
1 janv. 1990
29.274 mln.
-3.381 mln.
-10.35%
1 janv. 1991
44.163 mln.
+14.889 mln.
50.86%
1 janv. 1992
49.293 mln.
+5.13 mln.
11.62%
1 janv. 1993
73.674 mln.
+24.381 mln.
49.46%
1 janv. 1994
66.481 mln.
-7.193 mln.
-9.76%
1 janv. 1995
73.581 mln.
+7.1 mln.
10.68%
1 janv. 1996
67.03 mln.
-6.552 mln.
-8.9%
1 janv. 1997
53.033 mln.
-13.996 mln.
-20.88%
1 janv. 1998
62.64 mln.
+9.607 mln.
18.11%
1 janv. 1999
94.438 mln.
+31.798 mln.
50.76%
1 janv. 2000
98.964 mln.
+4.526 mln.
4.79%
1 janv. 2001
150.05 mln.
+51.087 mln.
51.62%
1 janv. 2002
163.168 mln.
+13.118 mln.
8.74%
1 janv. 2003
143.225 mln.
-19.943 mln.
-12.22%
1 janv. 2004
96.245 mln.
-46.98 mln.
-32.8%
1 janv. 2005
142.991 mln.
+46.746 mln.
48.57%
1 janv. 2006
164.672 mln.
+21.681 mln.
15.16%
1 janv. 2007
183.924 mln.
+19.252 mln.
11.69%
1 janv. 2008
185.184 mln.
+1.26 mln.
0.69%
1 janv. 2009
93.548 mln.
-91.636 mln.
-49.48%
1 janv. 2010
116.784 mln.
+23.236 mln.
24.84%
1 janv. 2011
111.373 mln.
-5.41 mln.
-4.63%
1 janv. 2012
137.403 mln.
+26.03 mln.
23.37%
1 janv. 2013
139.005 mln.
+1.602 mln.
1.17%
1 janv. 2014
272.401 mln.
+133.396 mln.
95.97%
Classement des pays selon les statistiques actuelles par années


Commentaires: