29
/fr/
fr
AIzaSyAYiBZKx7MnpbEhh9jyipgxe19OcubqV5w
April 1, 2024
69959
Argentina
ARG
true
2
1
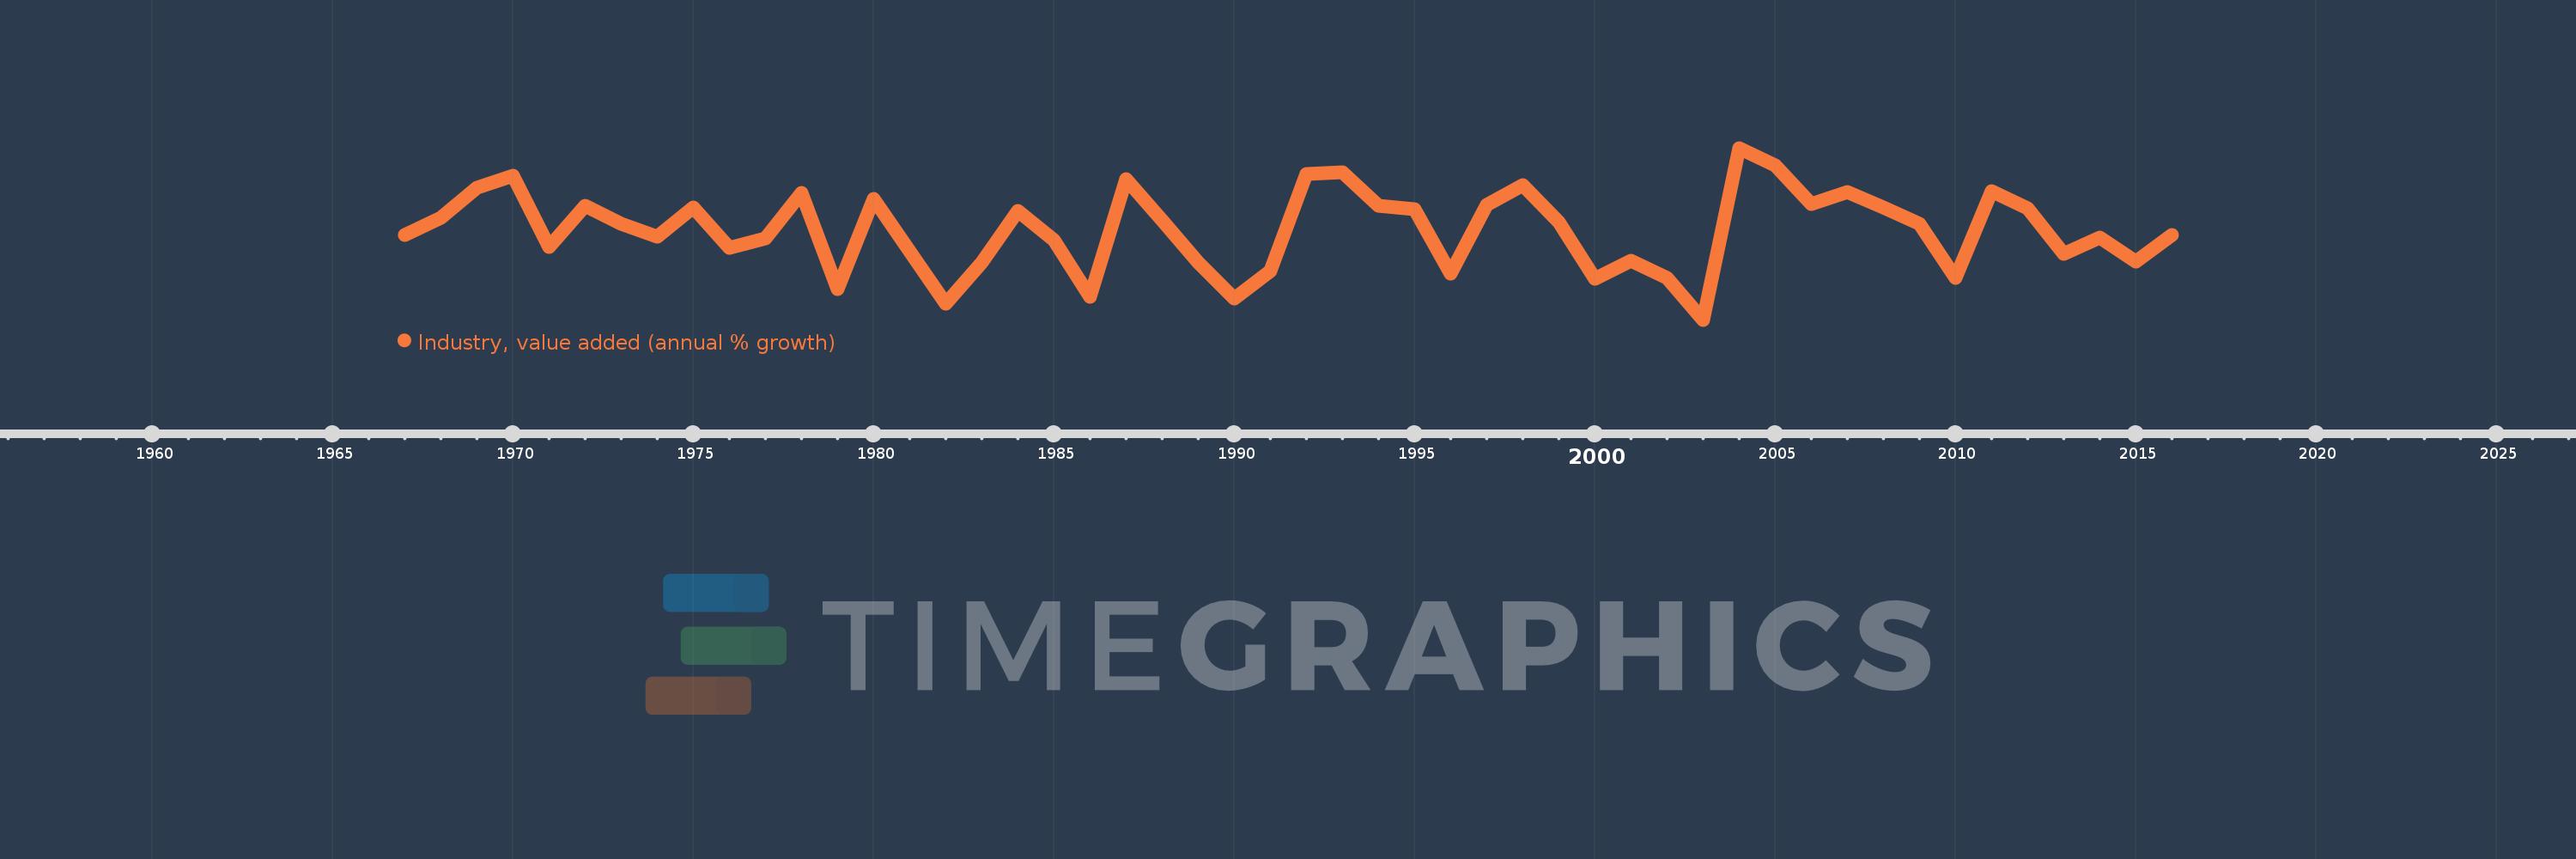
Industry, value added (annual % growth)
2016,2015,2014,2013,2012,2011,2010,2009,2008,2007,2006,2005,2004,2003,2002,2001,2000,1999,1998,1997,1996,1995,1994,1993,1992,1991,1990,1989,1988,1987,1986,1985,1984,1983,1982,1981,1980,1979,1978,1977,1976,1975,1974,1973,1972,1971,1970,1969,1968,1967
Cette statistique dans les autres pays:
AfghanistanAlbaniaAlgeriaAntigua and BarbudaArab WorldArgentinaArmeniaAustraliaAustriaAzerbaijanBahamas, TheBahrainBangladeshBelarusBelgiumBelizeBeninBermudaBhutanBoliviaBosnia and HerzegovinaBotswanaBrazilBrunei DarussalamBulgariaBurkina FasoBurundiCabo VerdeCambodiaCameroonCanadaCaribbean small statesCayman IslandsCentral African RepublicCentral Europe and the BalticsChadChileChinaColombiaComorosCongo, Dem. Rep.Congo, Rep.Costa RicaCote d'IvoireCroatiaCubaCyprusCzech RepublicDenmarkDjiboutiDominicaDominican RepublicEarly-demographic dividendEast Asia & PacificEast Asia & Pacific (excluding high income)East Asia & Pacific (IDA & IBRD countries)EcuadorEgypt, Arab Rep.El SalvadorEquatorial GuineaEritreaEstoniaEthiopiaEuro areaEurope & Central AsiaEurope & Central Asia (excluding high income)Europe & Central Asia (IDA & IBRD countries)European UnionFijiFinlandFragile and conflict affected situationsFranceGabonGambia, TheGeorgiaGermanyGhanaGreeceGrenadaGuatemalaGuineaGuinea-BissauGuyanaHaitiHeavily indebted poor countries (HIPC)High incomeHondurasHong Kong SAR, ChinaHungaryIBRD onlyIcelandIDA & IBRD totalIDA blendIDA onlyIDA totalIndiaIndonesiaIran, Islamic Rep.IraqIrelandItalyJamaicaJapanJordanKazakhstanKenyaKiribatiKorea, Rep.KosovoKuwaitKyrgyz RepublicLao PDRLate-demographic dividendLatin America & Caribbean Latin America & Caribbean (excluding high income)Latin America & the Caribbean (IDA & IBRD countries)LatviaLeast developed countries: UN classificationLebanonLesothoLiberiaLithuaniaLow & middle incomeLow incomeLower middle incomeLuxembourgMacedonia, FYRMadagascarMalawiMalaysiaMaldivesMaliMarshall IslandsMauritaniaMauritiusMexicoMicronesia, Fed. Sts.Middle East & North AfricaMiddle East & North Africa (excluding high income)Middle East & North Africa (IDA & IBRD countries)Middle incomeMoldovaMongoliaMontenegroMoroccoMozambiqueMyanmarNamibiaNepalNetherlandsNew ZealandNicaraguaNigerNigeriaNorth AmericaNorwayOECD membersOmanOther small statesPacific island small statesPakistanPalauPanamaPapua New GuineaParaguayPeruPhilippinesPolandPortugalPost-demographic dividendPre-demographic dividendPuerto RicoQatarRomaniaRussian FederationRwandaSamoaSao Tome and PrincipeSaudi ArabiaSenegalSerbiaSeychellesSierra LeoneSingaporeSlovak RepublicSloveniaSmall statesSolomon IslandsSomaliaSouth AfricaSouth AsiaSouth Asia (IDA & IBRD)SpainSri LankaSt. Kitts and NevisSt. LuciaSt. Vincent and the GrenadinesSub-Saharan Africa Sub-Saharan Africa (excluding high income)Sub-Saharan Africa (IDA & IBRD countries)SudanSurinameSwazilandSwedenSwitzerlandSyrian Arab RepublicTajikistanTanzaniaThailandTimor-LesteTogoTongaTrinidad and TobagoTunisiaTurkeyTurkmenistanTuvaluUgandaUkraineUnited Arab EmiratesUnited KingdomUnited StatesUpper middle incomeUruguayUzbekistanVanuatuVenezuela, RBVietnamWest Bank and GazaWorldZambiaZimbabwe La ligne de temps
Cette échelle de temps montre un graphique de 1967 année à 2016 année Argentina. Les données jusqu'à 1966 année ne sont pas présentés. Quantité d'observations actuelles selon dates: 50.
Source (désignation):
Les indicateurs du développement mondiale
Source (organisation):
World Bank national accounts data, and OECD National Accounts data files.
Catégories:
Economy & Growth
Dernière mise à jour
23 avr. 2017
Les indicateurs de changement de valeurs selon les années
Minimum:
-13.812
1 janv. 2003
Maximum:
16.491
1 janv. 2004
Pour la date d''observation
Valeur
Changement absolu
Le changement par rapport à la valeur précédente
1 janv. 1967
1.11
+1.11
0.0%
1 janv. 1968
4.231
+3.121
281.27%
1 janv. 1969
9.474
+5.243
123.92%
1 janv. 1970
11.546
+2.072
21.87%
1 janv. 1971
-0.93
-12.476
-108.06%
1 janv. 1972
6.329
+7.26
-780.38%
1 janv. 1973
3.124
-3.205
-50.64%
1 janv. 1974
0.806
-2.318
-74.21%
1 janv. 1975
6.038
+5.232
649.31%
1 janv. 1976
-1.091
-7.129
-118.07%
1 janv. 1977
0.556
+1.647
-150.93%
1 janv. 1978
8.629
+8.073
1.45 milles%
1 janv. 1979
-8.335
-16.964
-196.59%
1 janv. 1980
7.541
+15.876
-190.48%
1 janv. 1981
-1.761
-9.303
-123.35%
1 janv. 1982
-10.95
-9.189
521.71%
1 janv. 1983
-3.78
+7.169
-65.48%
1 janv. 1984
5.359
+9.139
-241.75%
1 janv. 1985
0.234
-5.124
-95.63%
1 janv. 1986
-9.724
-9.958
-4.25 milles%
1 janv. 1987
11.048
+20.772
-213.62%
1 janv. 1988
3.649
-7.398
-66.97%
1 janv. 1989
-3.746
-7.395
-202.64%
1 janv. 1990
-10.055
-6.309
168.44%
1 janv. 1991
-5.181
+4.875
-48.48%
1 janv. 1992
11.831
+17.012
-328.37%
1 janv. 1993
12.258
+0.426
3.6%
1 janv. 1994
6.311
-5.946
-48.51%
1 janv. 1995
5.715
-0.596
-9.44%
1 janv. 1996
-5.729
-11.444
-200.24%
1 janv. 1997
6.493
+12.222
-213.34%
1 janv. 1998
9.929
+3.436
52.91%
1 janv. 1999
3.377
-6.552
-65.99%
1 janv. 2000
-6.65
-10.026
-296.93%
1 janv. 2001
-3.367
+3.283
-49.36%
1 janv. 2002
-6.506
-3.139
93.21%
1 janv. 2003
-13.812
-7.306
112.3%
1 janv. 2004
16.491
+30.303
-219.4%
1 janv. 2005
13.369
-3.122
-18.93%
1 janv. 2006
6.537
-6.832
-51.1%
1 janv. 2007
8.667
+2.13
32.58%
1 janv. 2008
6.039
-2.628
-30.33%
1 janv. 2009
3.079
-2.959
-49.0%
1 janv. 2010
-6.448
-9.528
-309.4%
1 janv. 2011
8.849
+15.297
-237.23%
1 janv. 2012
5.828
-3.021
-34.14%
1 janv. 2013
-2.243
-8.071
-138.49%
1 janv. 2014
0.629
+2.872
-128.05%
1 janv. 2015
-3.519
-4.148
-659.33%
1 janv. 2016
1.103
+4.622
-131.35%
Classement des pays selon les statistiques actuelles par années


Commentaires: