29
/fr/
fr
AIzaSyAYiBZKx7MnpbEhh9jyipgxe19OcubqV5w
April 1, 2024
158546
Iraq
IRQ
true
2
1
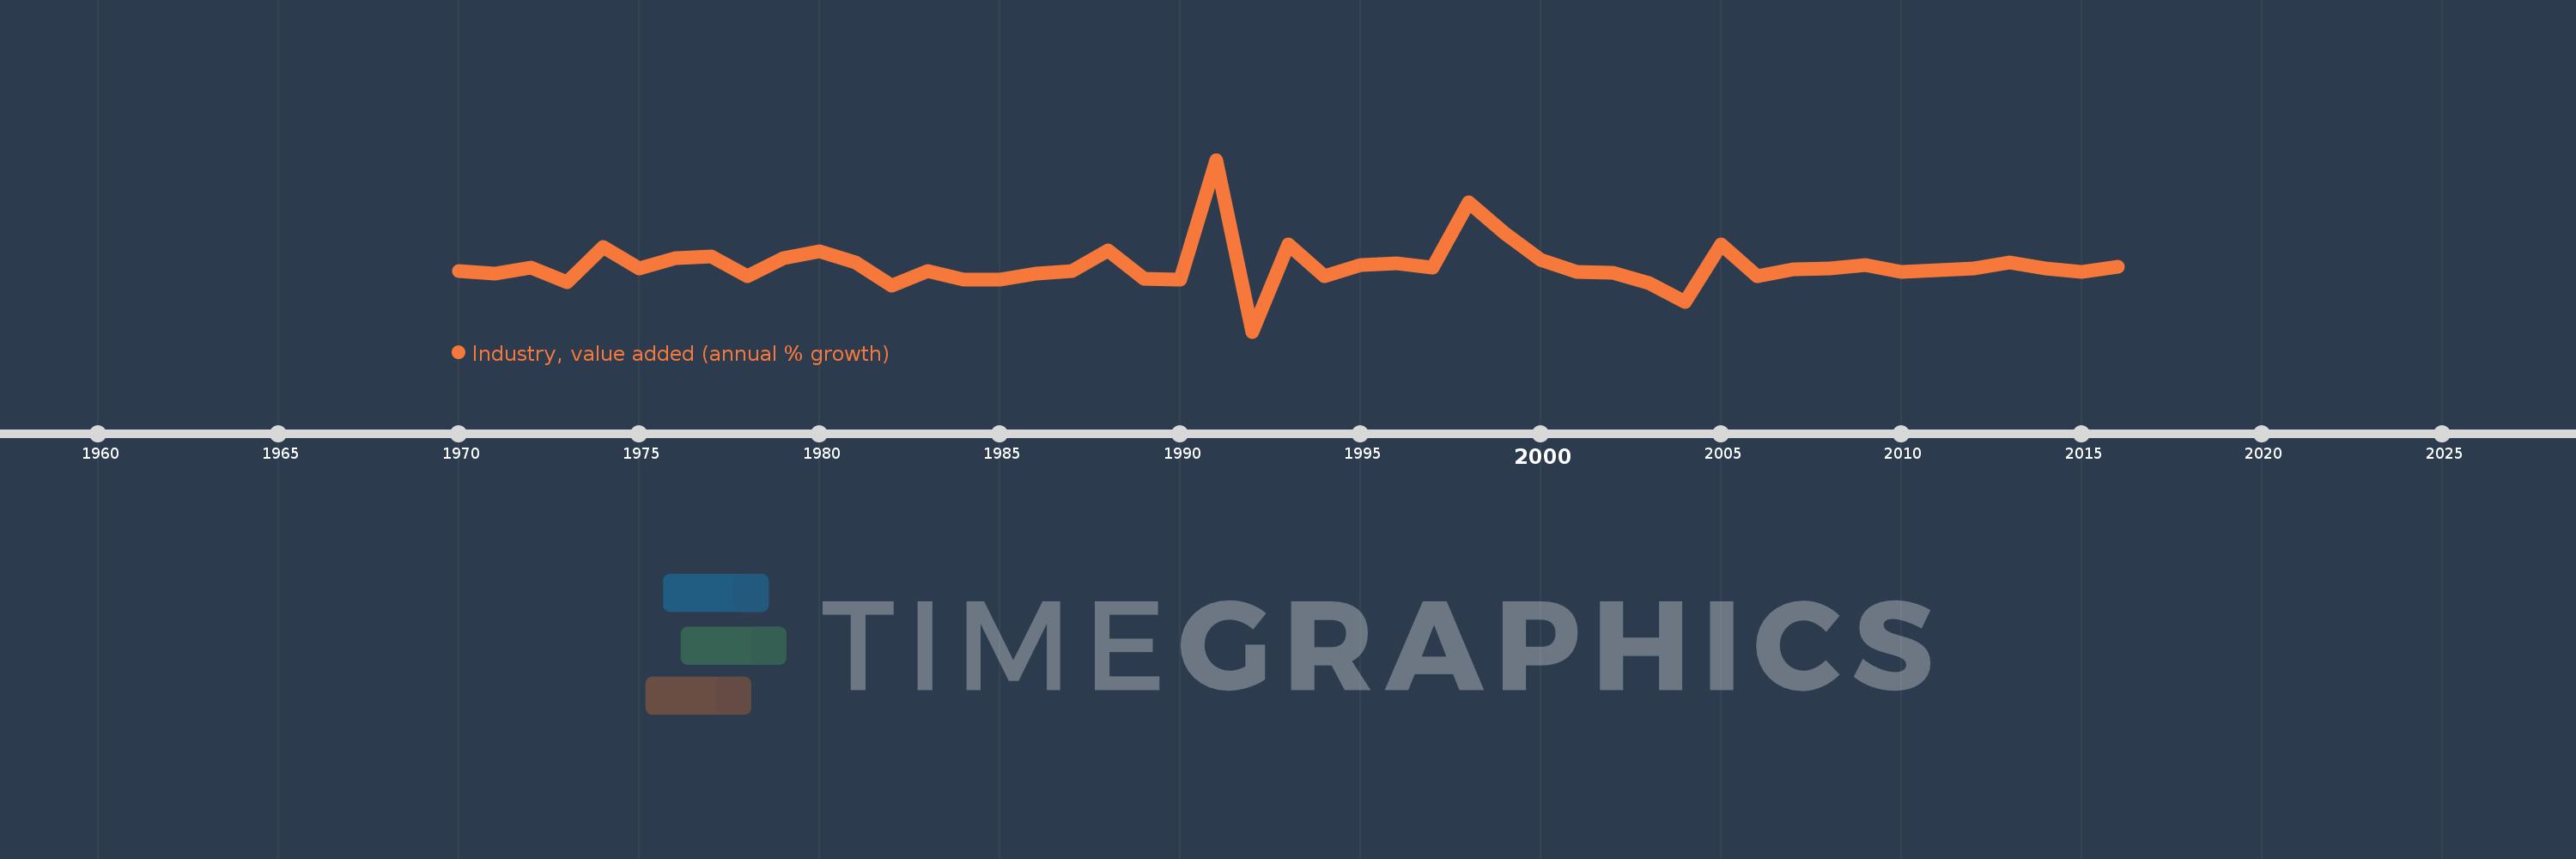
Industry, value added (annual % growth)
2016,2015,2014,2013,2012,2011,2010,2009,2008,2007,2006,2005,2004,2003,2002,2001,2000,1999,1998,1997,1996,1995,1994,1993,1992,1991,1990,1989,1988,1987,1986,1985,1984,1983,1982,1981,1980,1979,1978,1977,1976,1975,1974,1973,1972,1971,1970
Cette statistique dans les autres pays:
AfghanistanAlbaniaAlgeriaAntigua and BarbudaArab WorldArgentinaArmeniaAustraliaAustriaAzerbaijanBahamas, TheBahrainBangladeshBelarusBelgiumBelizeBeninBermudaBhutanBoliviaBosnia and HerzegovinaBotswanaBrazilBrunei DarussalamBulgariaBurkina FasoBurundiCabo VerdeCambodiaCameroonCanadaCaribbean small statesCayman IslandsCentral African RepublicCentral Europe and the BalticsChadChileChinaColombiaComorosCongo, Dem. Rep.Congo, Rep.Costa RicaCote d'IvoireCroatiaCubaCyprusCzech RepublicDenmarkDjiboutiDominicaDominican RepublicEarly-demographic dividendEast Asia & PacificEast Asia & Pacific (excluding high income)East Asia & Pacific (IDA & IBRD countries)EcuadorEgypt, Arab Rep.El SalvadorEquatorial GuineaEritreaEstoniaEthiopiaEuro areaEurope & Central AsiaEurope & Central Asia (excluding high income)Europe & Central Asia (IDA & IBRD countries)European UnionFijiFinlandFragile and conflict affected situationsFranceGabonGambia, TheGeorgiaGermanyGhanaGreeceGrenadaGuatemalaGuineaGuinea-BissauGuyanaHaitiHeavily indebted poor countries (HIPC)High incomeHondurasHong Kong SAR, ChinaHungaryIBRD onlyIcelandIDA & IBRD totalIDA blendIDA onlyIDA totalIndiaIndonesiaIran, Islamic Rep.IraqIrelandItalyJamaicaJapanJordanKazakhstanKenyaKiribatiKorea, Rep.KosovoKuwaitKyrgyz RepublicLao PDRLate-demographic dividendLatin America & Caribbean Latin America & Caribbean (excluding high income)Latin America & the Caribbean (IDA & IBRD countries)LatviaLeast developed countries: UN classificationLebanonLesothoLiberiaLithuaniaLow & middle incomeLow incomeLower middle incomeLuxembourgMacedonia, FYRMadagascarMalawiMalaysiaMaldivesMaliMarshall IslandsMauritaniaMauritiusMexicoMicronesia, Fed. Sts.Middle East & North AfricaMiddle East & North Africa (excluding high income)Middle East & North Africa (IDA & IBRD countries)Middle incomeMoldovaMongoliaMontenegroMoroccoMozambiqueMyanmarNamibiaNepalNetherlandsNew ZealandNicaraguaNigerNigeriaNorth AmericaNorwayOECD membersOmanOther small statesPacific island small statesPakistanPalauPanamaPapua New GuineaParaguayPeruPhilippinesPolandPortugalPost-demographic dividendPre-demographic dividendPuerto RicoQatarRomaniaRussian FederationRwandaSamoaSao Tome and PrincipeSaudi ArabiaSenegalSerbiaSeychellesSierra LeoneSingaporeSlovak RepublicSloveniaSmall statesSolomon IslandsSomaliaSouth AfricaSouth AsiaSouth Asia (IDA & IBRD)SpainSri LankaSt. Kitts and NevisSt. LuciaSt. Vincent and the GrenadinesSub-Saharan Africa Sub-Saharan Africa (excluding high income)Sub-Saharan Africa (IDA & IBRD countries)SudanSurinameSwazilandSwedenSwitzerlandSyrian Arab RepublicTajikistanTanzaniaThailandTimor-LesteTogoTongaTrinidad and TobagoTunisiaTurkeyTurkmenistanTuvaluUgandaUkraineUnited Arab EmiratesUnited KingdomUnited StatesUpper middle incomeUruguayUzbekistanVanuatuVenezuela, RBVietnamWest Bank and GazaWorldZambiaZimbabwe La ligne de temps
Cette échelle de temps montre un graphique de 1970 année à 2016 année Iraq. Les données jusqu'à 1969 année ne sont pas présentés. Quantité d'observations actuelles selon dates: 47.
Source (désignation):
Les indicateurs du développement mondiale
Source (organisation):
World Bank national accounts data, and OECD National Accounts data files.
Catégories:
Economy & Growth
Dernière mise à jour
23 avr. 2017
Les indicateurs de changement de valeurs selon les années
Minimum:
-79.518
1 janv. 1992
Maximum:
157.428
1 janv. 1991
Pour la date d''observation
Valeur
Changement absolu
Le changement par rapport à la valeur précédente
1 janv. 1970
3.707
+3.707
0.0%
1 janv. 1971
0.688
-3.019
-81.45%
1 janv. 1972
9.167
+8.479
1.23 milles%
1 janv. 1973
-11.819
-20.985
-228.93%
1 janv. 1974
36.703
+48.522
-410.56%
1 janv. 1975
7.117
-29.586
-80.61%
1 janv. 1976
21.943
+14.827
208.33%
1 janv. 1977
24.017
+2.073
9.45%
1 janv. 1978
-2.8
-26.817
-111.66%
1 janv. 1979
22.198
+24.998
-892.73%
1 janv. 1980
30.707
+8.509
38.33%
1 janv. 1981
15.614
-15.093
-49.15%
1 janv. 1982
-15.582
-31.196
-199.79%
1 janv. 1983
4.581
+20.163
-129.4%
1 janv. 1984
-7.818
-12.399
-270.67%
1 janv. 1985
-7.915
-0.097
1.24%
1 janv. 1986
0.271
+8.186
-103.43%
1 janv. 1987
3.713
+3.442
1.27 milles%
1 janv. 1988
32.77
+29.056
782.48%
1 janv. 1989
-7.099
-39.868
-121.66%
1 janv. 1990
-8.367
-1.268
17.86%
1 janv. 1991
157.428
+165.795
-1.98 milles%
1 janv. 1992
-79.518
-236.947
-150.51%
1 janv. 1993
40.639
+120.158
-151.11%
1 janv. 1994
-2.848
-43.487
-107.01%
1 janv. 1995
12.341
+15.189
-533.31%
1 janv. 1996
14.705
+2.365
19.16%
1 janv. 1997
8.446
-6.259
-42.56%
1 janv. 1998
99.136
+90.69
1.07 milles%
1 janv. 1999
55.988
-43.148
-43.52%
1 janv. 2000
19.44
-36.548
-65.28%
1 janv. 2001
2.233
-17.207
-88.51%
1 janv. 2002
1.659
-0.574
-25.71%
1 janv. 2003
-12.051
-13.71
-826.3%
1 janv. 2004
-38.566
-26.516
220.04%
1 janv. 2005
40.402
+78.968
-204.76%
1 janv. 2006
-2.779
-43.18
-106.88%
1 janv. 2007
5.828
+8.607
-309.73%
1 janv. 2008
7.14
+1.312
22.52%
1 janv. 2009
12.335
+5.195
72.75%
1 janv. 2010
2.863
-9.472
-76.79%
1 janv. 2011
5.065
+2.202
76.92%
1 janv. 2012
7.24
+2.175
42.93%
1 janv. 2013
15.648
+8.408
116.13%
1 janv. 2014
8.102
-7.546
-48.22%
1 janv. 2015
2.375
-5.728
-70.69%
1 janv. 2016
9.51
+7.136
300.52%
Classement des pays selon les statistiques actuelles par années


Commentaires: