29
/fr/
fr
AIzaSyAYiBZKx7MnpbEhh9jyipgxe19OcubqV5w
April 1, 2024
163897
Japan
JPN
true
2
1
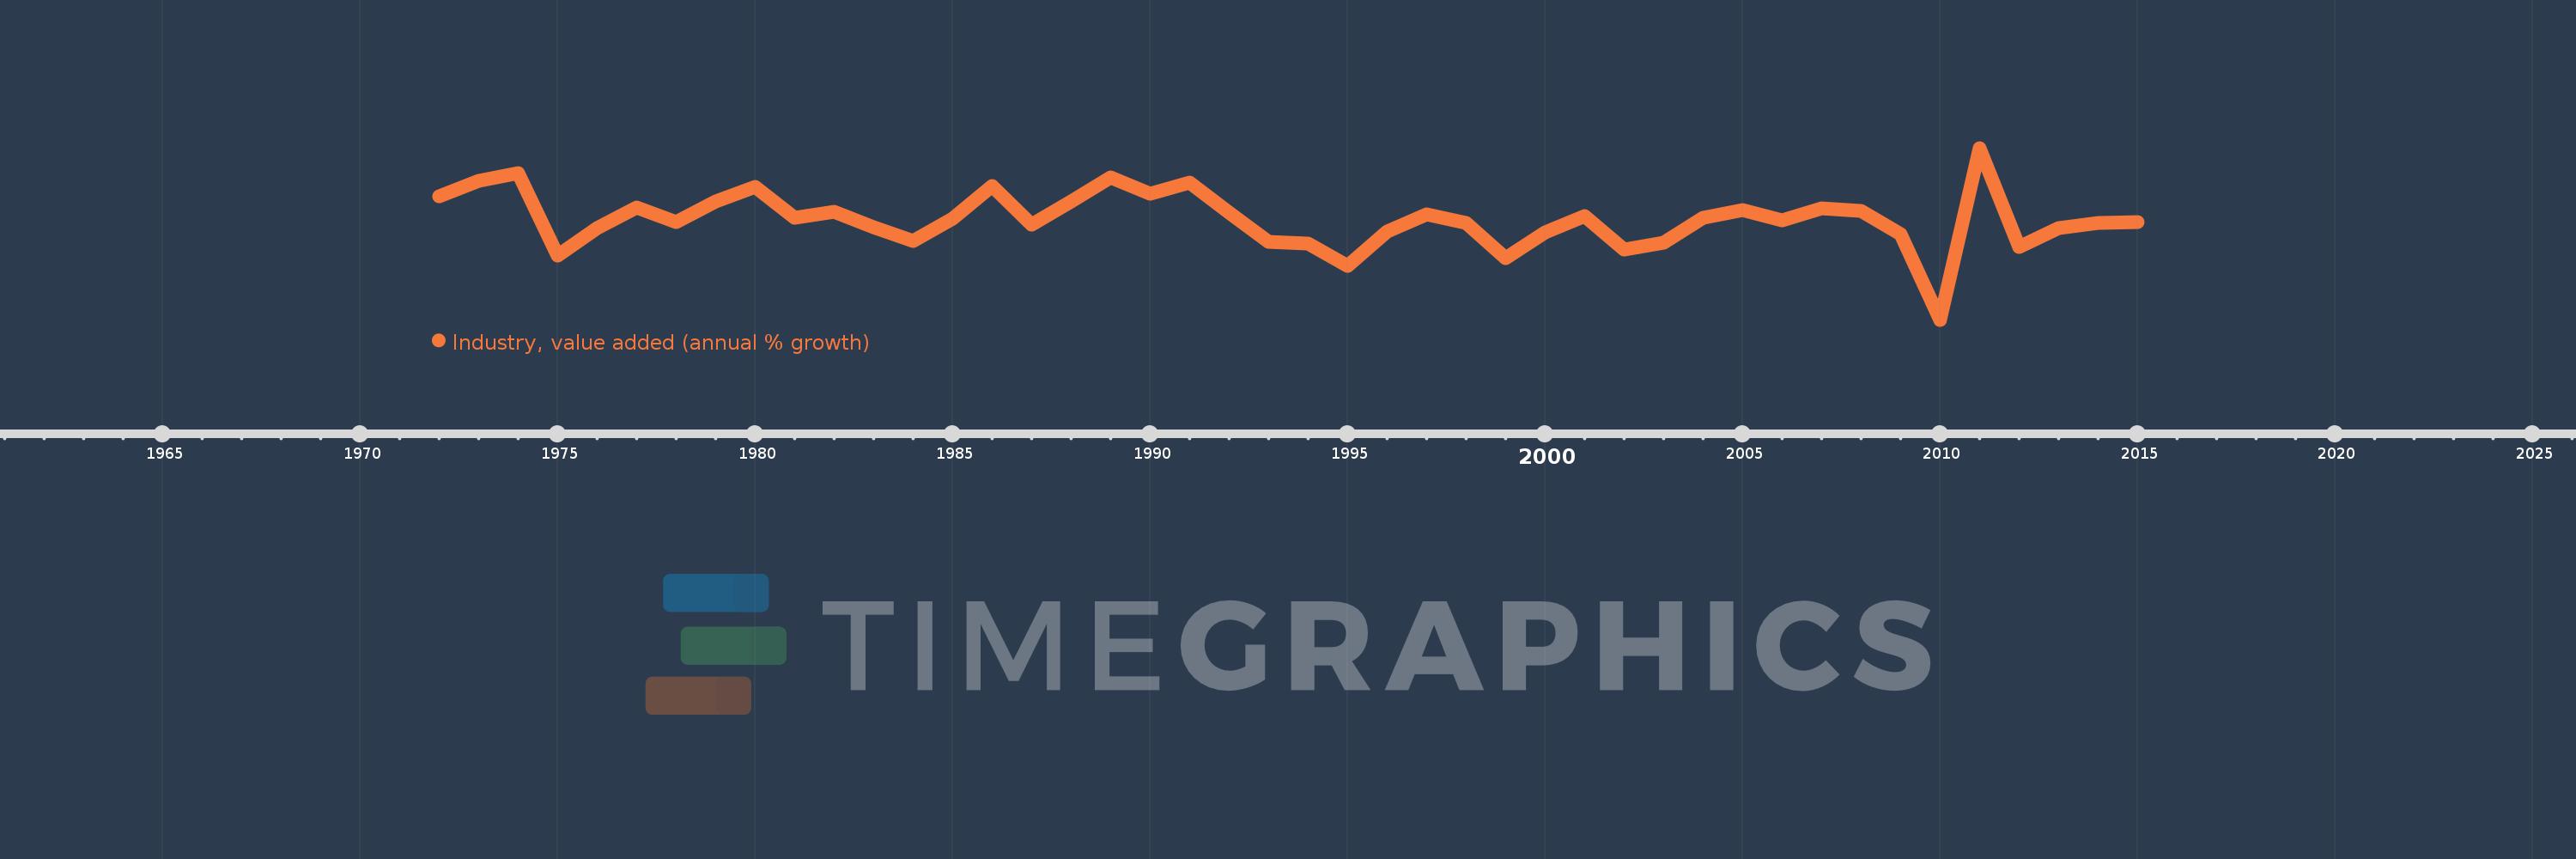
Industry, value added (annual % growth)
2015,2014,2013,2012,2011,2010,2009,2008,2007,2006,2005,2004,2003,2002,2001,2000,1999,1998,1997,1996,1995,1994,1993,1992,1991,1990,1989,1988,1987,1986,1985,1984,1983,1982,1981,1980,1979,1978,1977,1976,1975,1974,1973,1972
Cette statistique dans les autres pays:
AfghanistanAlbaniaAlgeriaAntigua and BarbudaArab WorldArgentinaArmeniaAustraliaAustriaAzerbaijanBahamas, TheBahrainBangladeshBelarusBelgiumBelizeBeninBermudaBhutanBoliviaBosnia and HerzegovinaBotswanaBrazilBrunei DarussalamBulgariaBurkina FasoBurundiCabo VerdeCambodiaCameroonCanadaCaribbean small statesCayman IslandsCentral African RepublicCentral Europe and the BalticsChadChileChinaColombiaComorosCongo, Dem. Rep.Congo, Rep.Costa RicaCote d'IvoireCroatiaCubaCyprusCzech RepublicDenmarkDjiboutiDominicaDominican RepublicEarly-demographic dividendEast Asia & PacificEast Asia & Pacific (excluding high income)East Asia & Pacific (IDA & IBRD countries)EcuadorEgypt, Arab Rep.El SalvadorEquatorial GuineaEritreaEstoniaEthiopiaEuro areaEurope & Central AsiaEurope & Central Asia (excluding high income)Europe & Central Asia (IDA & IBRD countries)European UnionFijiFinlandFragile and conflict affected situationsFranceGabonGambia, TheGeorgiaGermanyGhanaGreeceGrenadaGuatemalaGuineaGuinea-BissauGuyanaHaitiHeavily indebted poor countries (HIPC)High incomeHondurasHong Kong SAR, ChinaHungaryIBRD onlyIcelandIDA & IBRD totalIDA blendIDA onlyIDA totalIndiaIndonesiaIran, Islamic Rep.IraqIrelandItalyJamaicaJapanJordanKazakhstanKenyaKiribatiKorea, Rep.KosovoKuwaitKyrgyz RepublicLao PDRLate-demographic dividendLatin America & Caribbean Latin America & Caribbean (excluding high income)Latin America & the Caribbean (IDA & IBRD countries)LatviaLeast developed countries: UN classificationLebanonLesothoLiberiaLithuaniaLow & middle incomeLow incomeLower middle incomeLuxembourgMacedonia, FYRMadagascarMalawiMalaysiaMaldivesMaliMarshall IslandsMauritaniaMauritiusMexicoMicronesia, Fed. Sts.Middle East & North AfricaMiddle East & North Africa (excluding high income)Middle East & North Africa (IDA & IBRD countries)Middle incomeMoldovaMongoliaMontenegroMoroccoMozambiqueMyanmarNamibiaNepalNetherlandsNew ZealandNicaraguaNigerNigeriaNorth AmericaNorwayOECD membersOmanOther small statesPacific island small statesPakistanPalauPanamaPapua New GuineaParaguayPeruPhilippinesPolandPortugalPost-demographic dividendPre-demographic dividendPuerto RicoQatarRomaniaRussian FederationRwandaSamoaSao Tome and PrincipeSaudi ArabiaSenegalSerbiaSeychellesSierra LeoneSingaporeSlovak RepublicSloveniaSmall statesSolomon IslandsSomaliaSouth AfricaSouth AsiaSouth Asia (IDA & IBRD)SpainSri LankaSt. Kitts and NevisSt. LuciaSt. Vincent and the GrenadinesSub-Saharan Africa Sub-Saharan Africa (excluding high income)Sub-Saharan Africa (IDA & IBRD countries)SudanSurinameSwazilandSwedenSwitzerlandSyrian Arab RepublicTajikistanTanzaniaThailandTimor-LesteTogoTongaTrinidad and TobagoTunisiaTurkeyTurkmenistanTuvaluUgandaUkraineUnited Arab EmiratesUnited KingdomUnited StatesUpper middle incomeUruguayUzbekistanVanuatuVenezuela, RBVietnamWest Bank and GazaWorldZambiaZimbabwe La ligne de temps
Cette échelle de temps montre un graphique de 1972 année à 2015 année Japan. Les données jusqu'à 1971 année ne sont pas présentés. Quantité d'observations actuelles selon dates: 44.
Source (désignation):
Les indicateurs du développement mondiale
Source (organisation):
World Bank national accounts data, and OECD National Accounts data files.
Catégories:
Economy & Growth
Dernière mise à jour
23 avr. 2017
Les indicateurs de changement de valeurs selon les années
Minimum:
-14.671
1 janv. 2010
Maximum:
13.686
1 janv. 2011
Pour la date d''observation
Valeur
Changement absolu
Le changement par rapport à la valeur précédente
1 janv. 1972
5.722
+5.722
0.0%
1 janv. 1973
8.209
+2.487
43.47%
1 janv. 1974
9.529
+1.32
16.08%
1 janv. 1975
-4.049
-13.577
-142.49%
1 janv. 1976
0.484
+4.533
-111.96%
1 janv. 1977
3.793
+3.308
683.07%
1 janv. 1978
1.419
-2.373
-62.57%
1 janv. 1979
4.899
+3.479
245.1%
1 janv. 1980
7.227
+2.329
47.54%
1 janv. 1981
2.209
-5.019
-69.44%
1 janv. 1982
3.129
+0.921
41.68%
1 janv. 1983
0.538
-2.591
-82.81%
1 janv. 1984
-1.686
-2.224
-413.45%
1 janv. 1985
2.001
+3.687
-218.71%
1 janv. 1986
7.417
+5.415
270.61%
1 janv. 1987
1.077
-6.339
-85.48%
1 janv. 1988
4.846
+3.769
349.95%
1 janv. 1989
8.756
+3.909
80.67%
1 janv. 1990
6.171
-2.585
-29.53%
1 janv. 1991
8.041
+1.87
30.31%
1 janv. 1992
3.052
-4.989
-62.05%
1 janv. 1993
-1.879
-4.93
-161.57%
1 janv. 1994
-2.156
-0.277
14.75%
1 janv. 1995
-5.727
-3.571
165.63%
1 janv. 1996
-0.047
+5.68
-99.18%
1 janv. 1997
2.748
+2.794
-5.98 milles%
1 janv. 1998
1.312
-1.435
-52.24%
1 janv. 1999
-4.45
-5.762
-439.12%
1 janv. 2000
-0.188
+4.262
-95.78%
1 janv. 2001
2.496
+2.684
-1.43 milles%
1 janv. 2002
-3.137
-5.633
-225.68%
1 janv. 2003
-1.969
+1.168
-37.23%
1 janv. 2004
2.117
+4.086
-207.49%
1 janv. 2005
3.497
+1.38
65.19%
1 janv. 2006
1.796
-1.701
-48.64%
1 janv. 2007
3.683
+1.887
105.08%
1 janv. 2008
3.281
-0.402
-10.91%
1 janv. 2009
-0.465
-3.746
-114.16%
1 janv. 2010
-14.671
-14.206
3.06 milles%
1 janv. 2011
13.686
+28.357
-193.29%
1 janv. 2012
-2.713
-16.399
-119.82%
1 janv. 2013
0.45
+3.162
-116.58%
1 janv. 2014
1.315
+0.865
192.35%
1 janv. 2015
1.492
+0.178
13.51%
Classement des pays selon les statistiques actuelles par années


Commentaires: