29
/fr/
fr
AIzaSyAYiBZKx7MnpbEhh9jyipgxe19OcubqV5w
April 1, 2024
190387
Mali
MLI
true
2
1
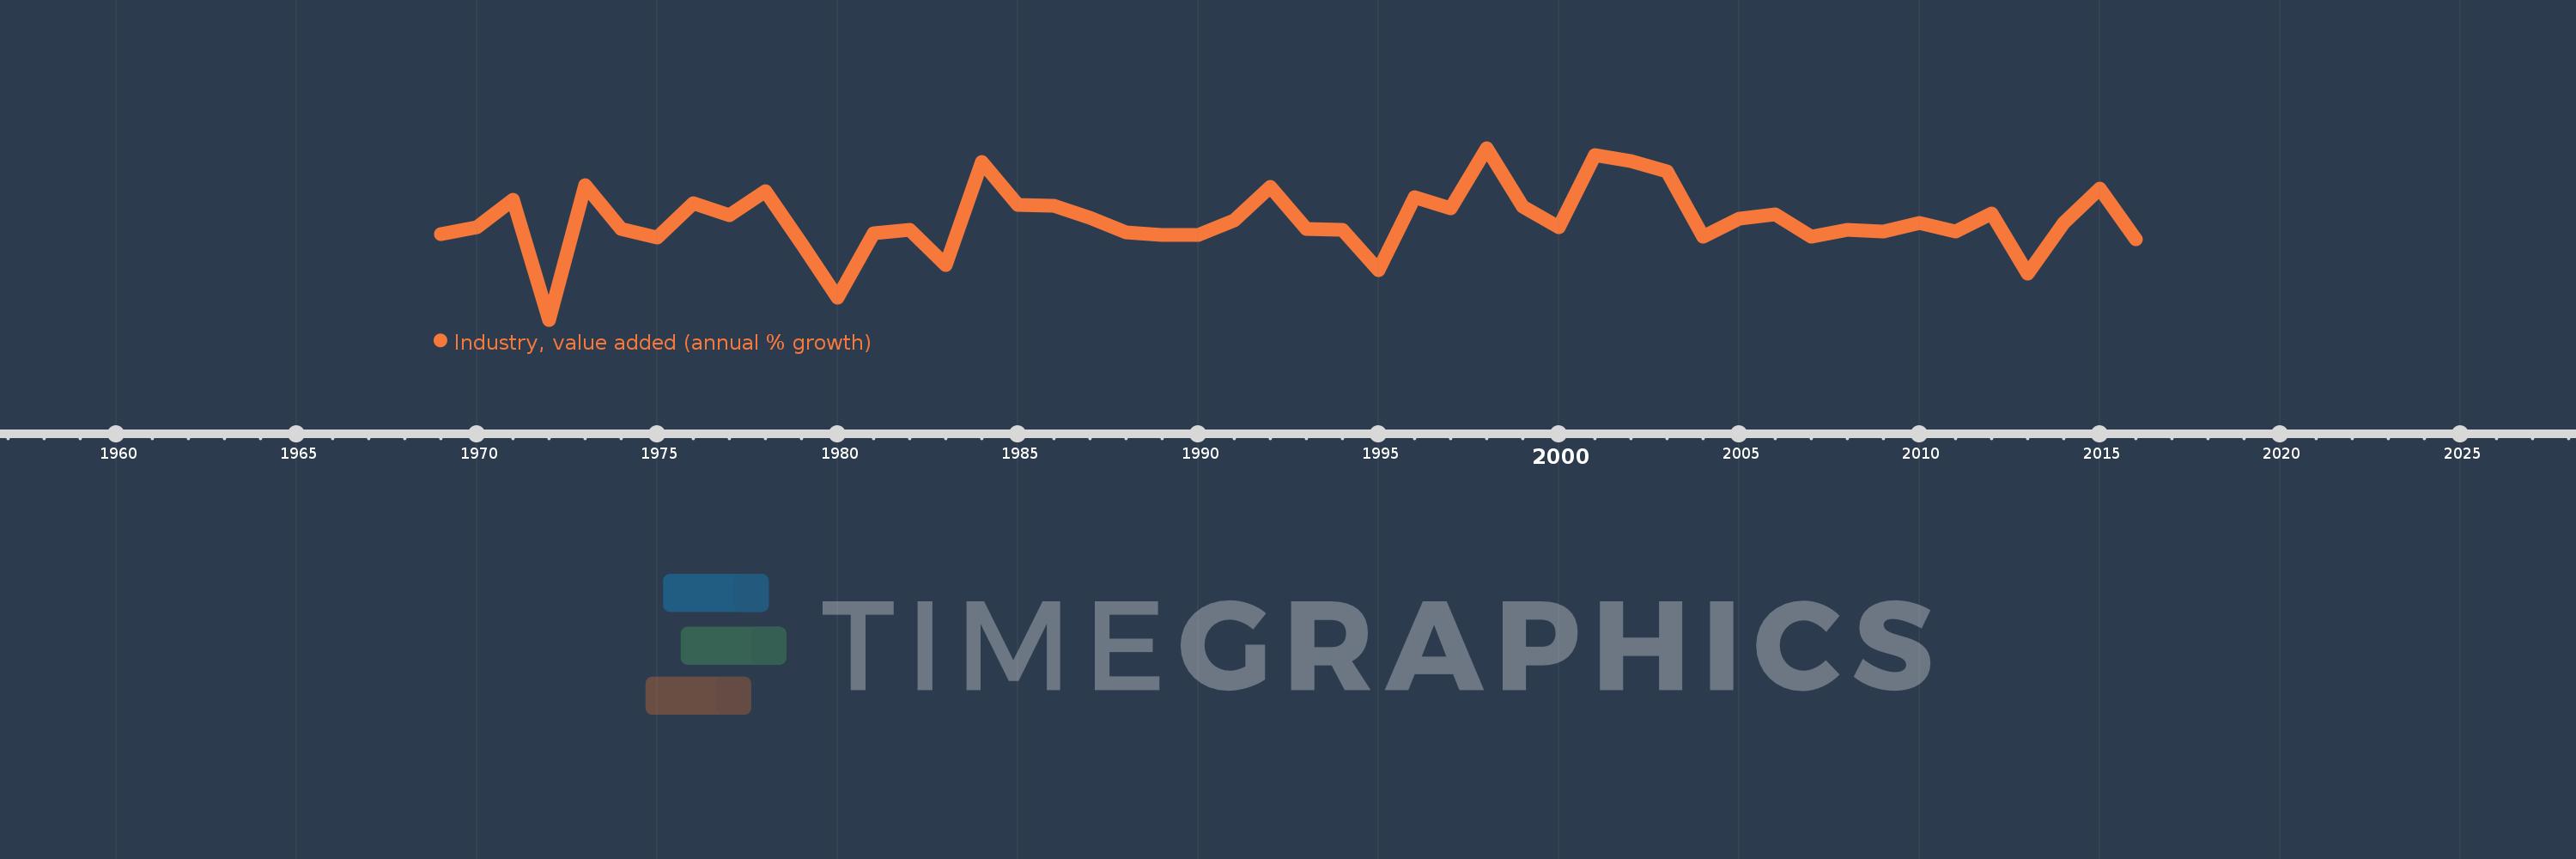
Industry, value added (annual % growth)
2016,2015,2014,2013,2012,2011,2010,2009,2008,2007,2006,2005,2004,2003,2002,2001,2000,1999,1998,1997,1996,1995,1994,1993,1992,1991,1990,1989,1988,1987,1986,1985,1984,1983,1982,1981,1980,1979,1978,1977,1976,1975,1974,1973,1972,1971,1970,1969
Cette statistique dans les autres pays:
AfghanistanAlbaniaAlgeriaAntigua and BarbudaArab WorldArgentinaArmeniaAustraliaAustriaAzerbaijanBahamas, TheBahrainBangladeshBelarusBelgiumBelizeBeninBermudaBhutanBoliviaBosnia and HerzegovinaBotswanaBrazilBrunei DarussalamBulgariaBurkina FasoBurundiCabo VerdeCambodiaCameroonCanadaCaribbean small statesCayman IslandsCentral African RepublicCentral Europe and the BalticsChadChileChinaColombiaComorosCongo, Dem. Rep.Congo, Rep.Costa RicaCote d'IvoireCroatiaCubaCyprusCzech RepublicDenmarkDjiboutiDominicaDominican RepublicEarly-demographic dividendEast Asia & PacificEast Asia & Pacific (excluding high income)East Asia & Pacific (IDA & IBRD countries)EcuadorEgypt, Arab Rep.El SalvadorEquatorial GuineaEritreaEstoniaEthiopiaEuro areaEurope & Central AsiaEurope & Central Asia (excluding high income)Europe & Central Asia (IDA & IBRD countries)European UnionFijiFinlandFragile and conflict affected situationsFranceGabonGambia, TheGeorgiaGermanyGhanaGreeceGrenadaGuatemalaGuineaGuinea-BissauGuyanaHaitiHeavily indebted poor countries (HIPC)High incomeHondurasHong Kong SAR, ChinaHungaryIBRD onlyIcelandIDA & IBRD totalIDA blendIDA onlyIDA totalIndiaIndonesiaIran, Islamic Rep.IraqIrelandItalyJamaicaJapanJordanKazakhstanKenyaKiribatiKorea, Rep.KosovoKuwaitKyrgyz RepublicLao PDRLate-demographic dividendLatin America & Caribbean Latin America & Caribbean (excluding high income)Latin America & the Caribbean (IDA & IBRD countries)LatviaLeast developed countries: UN classificationLebanonLesothoLiberiaLithuaniaLow & middle incomeLow incomeLower middle incomeLuxembourgMacedonia, FYRMadagascarMalawiMalaysiaMaldivesMaliMarshall IslandsMauritaniaMauritiusMexicoMicronesia, Fed. Sts.Middle East & North AfricaMiddle East & North Africa (excluding high income)Middle East & North Africa (IDA & IBRD countries)Middle incomeMoldovaMongoliaMontenegroMoroccoMozambiqueMyanmarNamibiaNepalNetherlandsNew ZealandNicaraguaNigerNigeriaNorth AmericaNorwayOECD membersOmanOther small statesPacific island small statesPakistanPalauPanamaPapua New GuineaParaguayPeruPhilippinesPolandPortugalPost-demographic dividendPre-demographic dividendPuerto RicoQatarRomaniaRussian FederationRwandaSamoaSao Tome and PrincipeSaudi ArabiaSenegalSerbiaSeychellesSierra LeoneSingaporeSlovak RepublicSloveniaSmall statesSolomon IslandsSomaliaSouth AfricaSouth AsiaSouth Asia (IDA & IBRD)SpainSri LankaSt. Kitts and NevisSt. LuciaSt. Vincent and the GrenadinesSub-Saharan Africa Sub-Saharan Africa (excluding high income)Sub-Saharan Africa (IDA & IBRD countries)SudanSurinameSwazilandSwedenSwitzerlandSyrian Arab RepublicTajikistanTanzaniaThailandTimor-LesteTogoTongaTrinidad and TobagoTunisiaTurkeyTurkmenistanTuvaluUgandaUkraineUnited Arab EmiratesUnited KingdomUnited StatesUpper middle incomeUruguayUzbekistanVanuatuVenezuela, RBVietnamWest Bank and GazaWorldZambiaZimbabwe La ligne de temps
Cette échelle de temps montre un graphique de 1969 année à 2016 année Mali. Les données jusqu'à 1968 année ne sont pas présentés. Quantité d'observations actuelles selon dates: 48.
Source (désignation):
Les indicateurs du développement mondiale
Source (organisation):
World Bank national accounts data, and OECD National Accounts data files.
Catégories:
Economy & Growth
Dernière mise à jour
23 avr. 2017
Les indicateurs de changement de valeurs selon les années
Minimum:
-21.422
1 janv. 1972
Maximum:
23.314
1 janv. 1998
Pour la date d''observation
Valeur
Changement absolu
Le changement par rapport à la valeur précédente
1 janv. 1969
0.934
+0.934
0.0%
1 janv. 1970
2.779
+1.845
197.42%
1 janv. 1971
9.91
+7.131
256.58%
1 janv. 1972
-21.422
-31.332
-316.17%
1 janv. 1973
13.603
+35.025
-163.5%
1 janv. 1974
2.111
-11.492
-84.48%
1 janv. 1975
0.0
-2.111
-100.0%
1 janv. 1976
8.964
+8.964
%
1 janv. 1977
5.697
-3.267
-36.45%
1 janv. 1978
11.975
+6.278
110.2%
1 janv. 1979
-1.605
-13.58
-113.4%
1 janv. 1980
-15.76
-14.156
882.25%
1 janv. 1981
1.087
+16.848
-106.9%
1 janv. 1982
1.988
+0.9
82.77%
1 janv. 1983
-7.231
-9.219
-463.82%
1 janv. 1984
19.611
+26.843
-371.19%
1 janv. 1985
8.513
-11.098
-56.59%
1 janv. 1986
8.344
-0.169
-1.98%
1 janv. 1987
5.13
-3.214
-38.52%
1 janv. 1988
1.243
-3.887
-75.77%
1 janv. 1989
0.6
-0.643
-51.73%
1 janv. 1990
0.661
+0.061
10.24%
1 janv. 1991
4.543
+3.882
586.81%
1 janv. 1992
13.07
+8.527
187.69%
1 janv. 1993
2.239
-10.831
-82.87%
1 janv. 1994
1.963
-0.276
-12.33%
1 janv. 1995
-8.587
-10.55
-537.43%
1 janv. 1996
10.573
+19.159
-223.13%
1 janv. 1997
7.52
-3.053
-28.87%
1 janv. 1998
23.314
+15.794
210.03%
1 janv. 1999
8.142
-15.172
-65.08%
1 janv. 2000
2.737
-5.405
-66.38%
1 janv. 2001
21.402
+18.665
681.87%
1 janv. 2002
19.788
-1.614
-7.54%
1 janv. 2003
17.309
-2.479
-12.53%
1 janv. 2004
0.097
-17.212
-99.44%
1 janv. 2005
4.984
+4.887
5.03 milles%
1 janv. 2006
6.076
+1.092
21.91%
1 janv. 2007
0.157
-5.919
-97.41%
1 janv. 2008
1.951
+1.794
1.14 milles%
1 janv. 2009
1.566
-0.385
-19.72%
1 janv. 2010
3.811
+2.244
143.31%
1 janv. 2011
1.444
-2.366
-62.1%
1 janv. 2012
6.353
+4.908
339.89%
1 janv. 2013
-9.368
-15.721
-247.47%
1 janv. 2014
3.755
+13.124
-140.09%
1 janv. 2015
12.757
+9.001
239.69%
1 janv. 2016
-0.57
-13.327
-104.47%
Classement des pays selon les statistiques actuelles par années


Commentaires: