29
/fr/
fr
AIzaSyAYiBZKx7MnpbEhh9jyipgxe19OcubqV5w
April 1, 2024
66144
Algeria
DZA
true
2
1
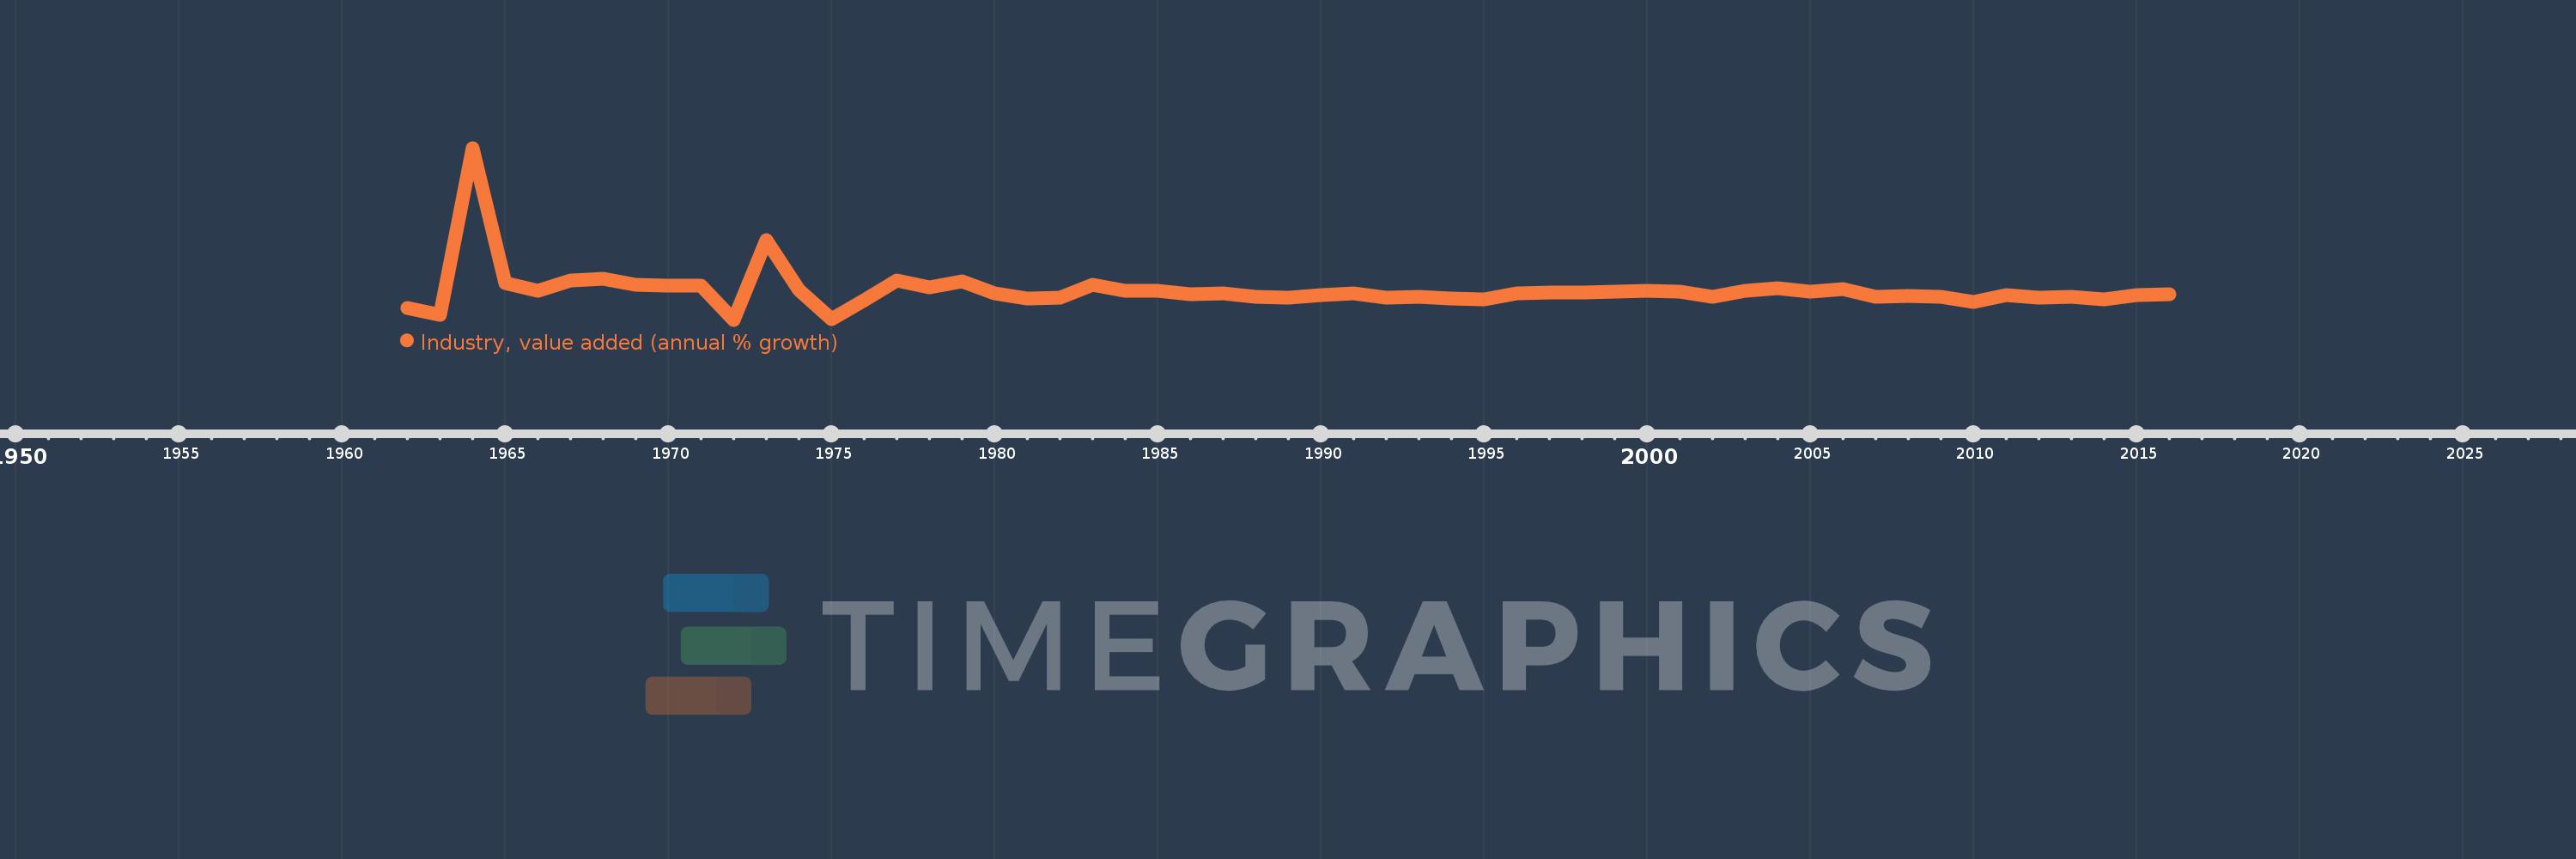
Industry, value added (annual % growth)
2016,2015,2014,2013,2012,2011,2010,2009,2008,2007,2006,2005,2004,2003,2002,2001,2000,1999,1998,1997,1996,1995,1994,1993,1992,1991,1990,1989,1988,1987,1986,1985,1984,1983,1982,1981,1980,1979,1978,1977,1976,1975,1974,1973,1972,1971,1970,1969,1968,1967,1966,1965,1964,1963,1962
Cette statistique dans les autres pays:
AfghanistanAlbaniaAlgeriaAntigua and BarbudaArab WorldArgentinaArmeniaAustraliaAustriaAzerbaijanBahamas, TheBahrainBangladeshBelarusBelgiumBelizeBeninBermudaBhutanBoliviaBosnia and HerzegovinaBotswanaBrazilBrunei DarussalamBulgariaBurkina FasoBurundiCabo VerdeCambodiaCameroonCanadaCaribbean small statesCayman IslandsCentral African RepublicCentral Europe and the BalticsChadChileChinaColombiaComorosCongo, Dem. Rep.Congo, Rep.Costa RicaCote d'IvoireCroatiaCubaCyprusCzech RepublicDenmarkDjiboutiDominicaDominican RepublicEarly-demographic dividendEast Asia & PacificEast Asia & Pacific (excluding high income)East Asia & Pacific (IDA & IBRD countries)EcuadorEgypt, Arab Rep.El SalvadorEquatorial GuineaEritreaEstoniaEthiopiaEuro areaEurope & Central AsiaEurope & Central Asia (excluding high income)Europe & Central Asia (IDA & IBRD countries)European UnionFijiFinlandFragile and conflict affected situationsFranceGabonGambia, TheGeorgiaGermanyGhanaGreeceGrenadaGuatemalaGuineaGuinea-BissauGuyanaHaitiHeavily indebted poor countries (HIPC)High incomeHondurasHong Kong SAR, ChinaHungaryIBRD onlyIcelandIDA & IBRD totalIDA blendIDA onlyIDA totalIndiaIndonesiaIran, Islamic Rep.IraqIrelandItalyJamaicaJapanJordanKazakhstanKenyaKiribatiKorea, Rep.KosovoKuwaitKyrgyz RepublicLao PDRLate-demographic dividendLatin America & Caribbean Latin America & Caribbean (excluding high income)Latin America & the Caribbean (IDA & IBRD countries)LatviaLeast developed countries: UN classificationLebanonLesothoLiberiaLithuaniaLow & middle incomeLow incomeLower middle incomeLuxembourgMacedonia, FYRMadagascarMalawiMalaysiaMaldivesMaliMarshall IslandsMauritaniaMauritiusMexicoMicronesia, Fed. Sts.Middle East & North AfricaMiddle East & North Africa (excluding high income)Middle East & North Africa (IDA & IBRD countries)Middle incomeMoldovaMongoliaMontenegroMoroccoMozambiqueMyanmarNamibiaNepalNetherlandsNew ZealandNicaraguaNigerNigeriaNorth AmericaNorwayOECD membersOmanOther small statesPacific island small statesPakistanPalauPanamaPapua New GuineaParaguayPeruPhilippinesPolandPortugalPost-demographic dividendPre-demographic dividendPuerto RicoQatarRomaniaRussian FederationRwandaSamoaSao Tome and PrincipeSaudi ArabiaSenegalSerbiaSeychellesSierra LeoneSingaporeSlovak RepublicSloveniaSmall statesSolomon IslandsSomaliaSouth AfricaSouth AsiaSouth Asia (IDA & IBRD)SpainSri LankaSt. Kitts and NevisSt. LuciaSt. Vincent and the GrenadinesSub-Saharan Africa Sub-Saharan Africa (excluding high income)Sub-Saharan Africa (IDA & IBRD countries)SudanSurinameSwazilandSwedenSwitzerlandSyrian Arab RepublicTajikistanTanzaniaThailandTimor-LesteTogoTongaTrinidad and TobagoTunisiaTurkeyTurkmenistanTuvaluUgandaUkraineUnited Arab EmiratesUnited KingdomUnited StatesUpper middle incomeUruguayUzbekistanVanuatuVenezuela, RBVietnamWest Bank and GazaWorldZambiaZimbabwe La ligne de temps
Cette échelle de temps montre un graphique de 1962 année à 2016 année Algeria. Les données jusqu'à 1961 année ne sont pas présentés. Quantité d'observations actuelles selon dates: 55.
Source (désignation):
Les indicateurs du développement mondiale
Source (organisation):
World Bank national accounts data, and OECD National Accounts data files.
Catégories:
Economy & Growth
Dernière mise à jour
23 avr. 2017
Les indicateurs de changement de valeurs selon les années
Minimum:
-19.305
1 janv. 1972
Maximum:
123.731
1 janv. 1964
Pour la date d''observation
Valeur
Changement absolu
Le changement par rapport à la valeur précédente
1 janv. 1962
-9.322
-9.322
0.0%
1 janv. 1963
-15.188
-5.866
62.92%
1 janv. 1964
123.731
+138.92
-914.65%
1 janv. 1965
11.289
-112.442
-90.88%
1 janv. 1966
4.79
-6.499
-57.57%
1 janv. 1967
13.072
+8.282
172.88%
1 janv. 1968
15.029
+1.957
14.97%
1 janv. 1969
9.548
-5.481
-36.47%
1 janv. 1970
9.174
-0.373
-3.91%
1 janv. 1971
8.824
-0.351
-3.82%
1 janv. 1972
-19.305
-28.129
-318.79%
1 janv. 1973
47.129
+66.434
-344.13%
1 janv. 1974
5.528
-41.601
-88.27%
1 janv. 1975
-19.106
-24.635
-445.6%
1 janv. 1976
-3.048
+16.059
-84.05%
1 janv. 1977
13.556
+16.604
-544.81%
1 janv. 1978
7.785
-5.771
-42.57%
1 janv. 1979
12.36
+4.574
58.75%
1 janv. 1980
2.714
-9.645
-78.04%
1 janv. 1981
-1.34
-4.054
-149.37%
1 janv. 1982
-0.874
+0.466
-34.78%
1 janv. 1983
9.478
+10.352
-1.18 milles%
1 janv. 1984
5.144
-4.334
-45.72%
1 janv. 1985
4.702
-0.442
-8.6%
1 janv. 1986
2.15
-2.551
-54.26%
1 janv. 1987
2.886
+0.735
34.2%
1 janv. 1988
-0.1
-2.986
-103.48%
1 janv. 1989
-0.854
-0.754
751.42%
1 janv. 1990
1.023
+1.877
-219.76%
1 janv. 1991
2.55
+1.528
149.4%
1 janv. 1992
-1.087
-3.638
-142.62%
1 janv. 1993
-0.476
+0.611
-56.22%
1 janv. 1994
-1.464
-0.988
207.5%
1 janv. 1995
-2.312
-0.848
57.95%
1 janv. 1996
2.89
+5.201
-225.01%
1 janv. 1997
3.055
+0.165
5.7%
1 janv. 1998
3.705
+0.65
21.29%
1 janv. 1999
4.437
+0.733
19.77%
1 janv. 2000
4.545
+0.108
2.43%
1 janv. 2001
4.324
-0.221
-4.86%
1 janv. 2002
0.068
-4.256
-98.42%
1 janv. 2003
5.104
+5.035
7.35 milles%
1 janv. 2004
7.04
+1.936
37.94%
1 janv. 2005
4.041
-2.999
-42.6%
1 janv. 2006
6.07
+2.029
50.22%
1 janv. 2007
-0.29
-6.36
-104.78%
1 janv. 2008
0.77
+1.06
-365.65%
1 janv. 2009
-0.544
-1.314
-170.58%
1 janv. 2010
-4.237
-3.694
679.34%
1 janv. 2011
1.015
+5.252
-123.94%
1 janv. 2012
-0.801
-1.815
-178.92%
1 janv. 2013
-0.503
+0.298
-37.21%
1 janv. 2014
-2.233
-1.731
344.21%
1 janv. 2015
1.504
+3.737
-167.34%
1 janv. 2016
2.088
+0.584
38.85%
Classement des pays selon les statistiques actuelles par années


Commentaires: