29
/fr/
fr
AIzaSyAYiBZKx7MnpbEhh9jyipgxe19OcubqV5w
April 1, 2024
269477
Turkey
TUR
true
2
1
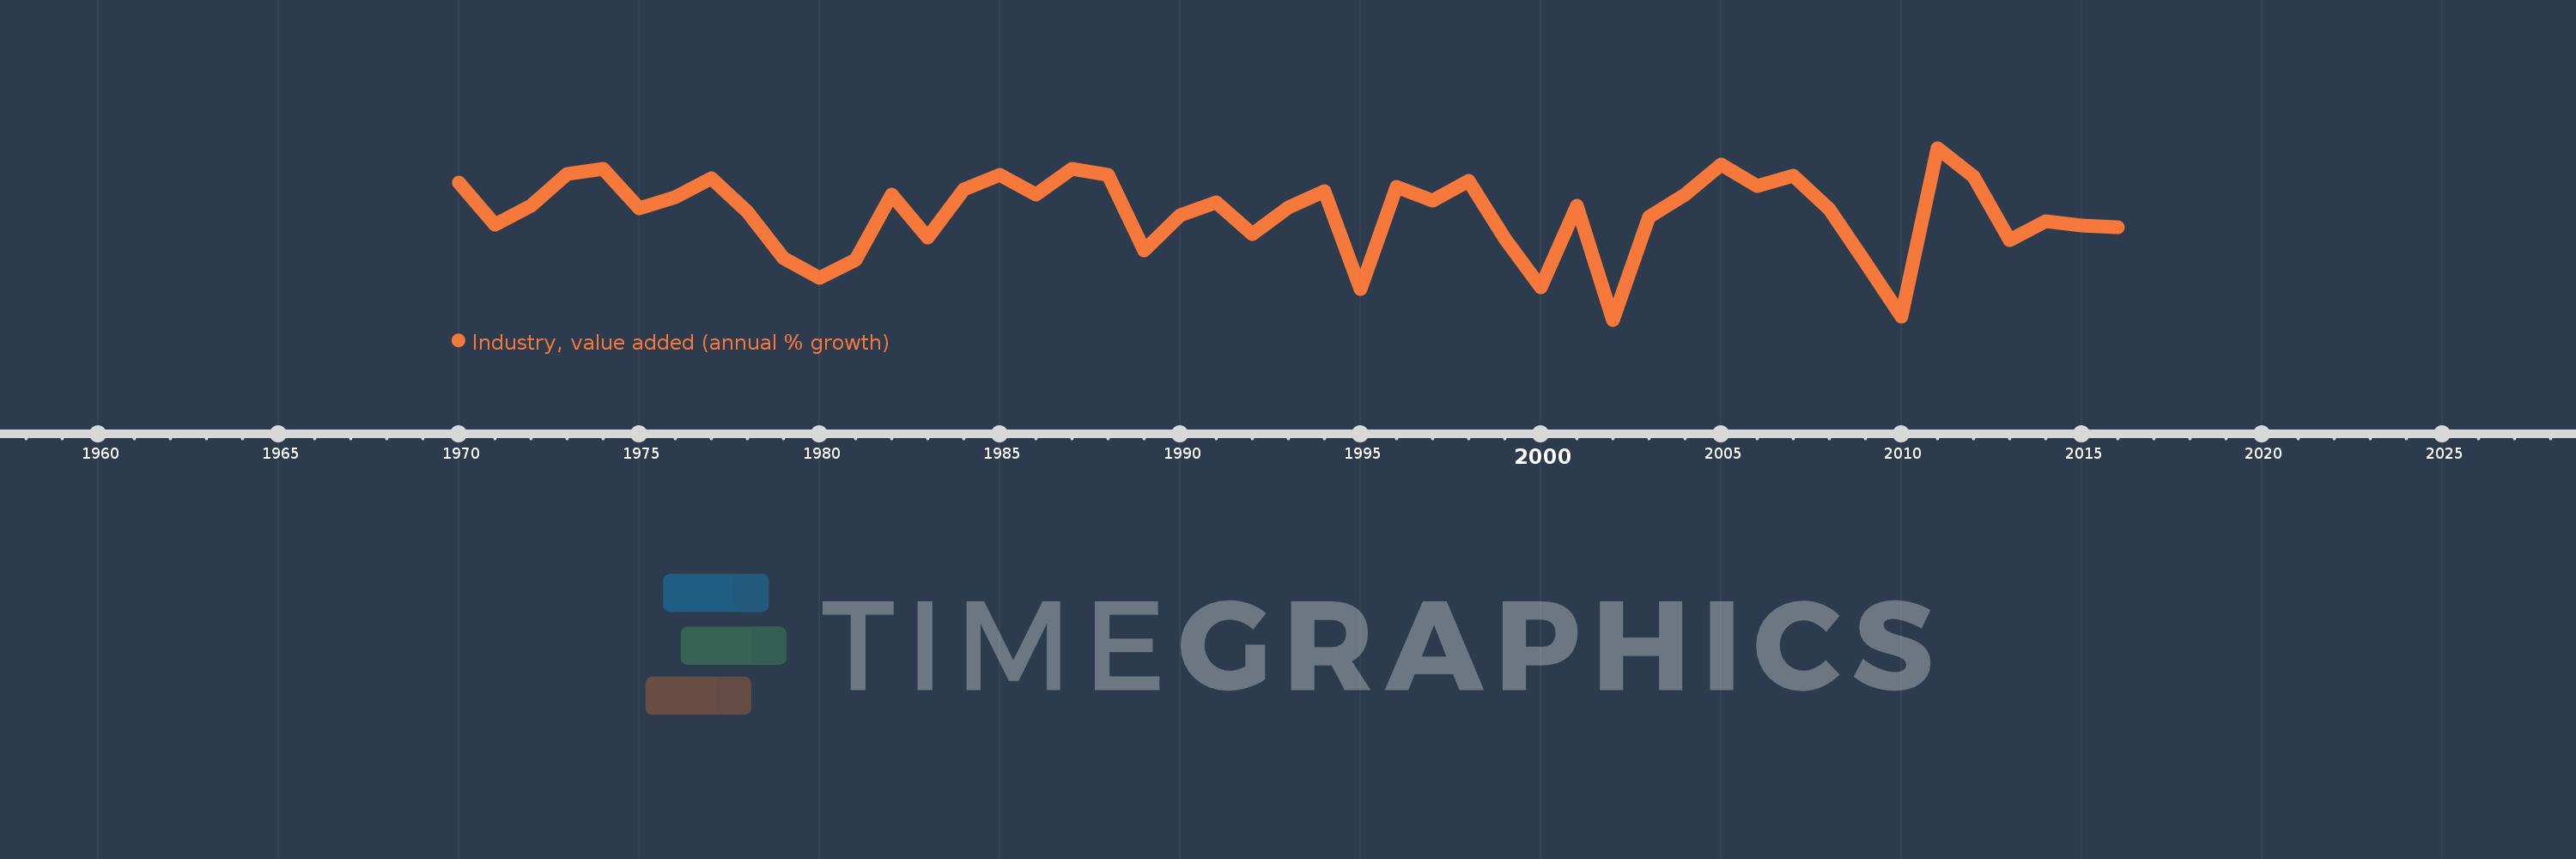
Industry, value added (annual % growth)
2016,2015,2014,2013,2012,2011,2010,2009,2008,2007,2006,2005,2004,2003,2002,2001,2000,1999,1998,1997,1996,1995,1994,1993,1992,1991,1990,1989,1988,1987,1986,1985,1984,1983,1982,1981,1980,1979,1978,1977,1976,1975,1974,1973,1972,1971,1970
Cette statistique dans les autres pays:
AfghanistanAlbaniaAlgeriaAntigua and BarbudaArab WorldArgentinaArmeniaAustraliaAustriaAzerbaijanBahamas, TheBahrainBangladeshBelarusBelgiumBelizeBeninBermudaBhutanBoliviaBosnia and HerzegovinaBotswanaBrazilBrunei DarussalamBulgariaBurkina FasoBurundiCabo VerdeCambodiaCameroonCanadaCaribbean small statesCayman IslandsCentral African RepublicCentral Europe and the BalticsChadChileChinaColombiaComorosCongo, Dem. Rep.Congo, Rep.Costa RicaCote d'IvoireCroatiaCubaCyprusCzech RepublicDenmarkDjiboutiDominicaDominican RepublicEarly-demographic dividendEast Asia & PacificEast Asia & Pacific (excluding high income)East Asia & Pacific (IDA & IBRD countries)EcuadorEgypt, Arab Rep.El SalvadorEquatorial GuineaEritreaEstoniaEthiopiaEuro areaEurope & Central AsiaEurope & Central Asia (excluding high income)Europe & Central Asia (IDA & IBRD countries)European UnionFijiFinlandFragile and conflict affected situationsFranceGabonGambia, TheGeorgiaGermanyGhanaGreeceGrenadaGuatemalaGuineaGuinea-BissauGuyanaHaitiHeavily indebted poor countries (HIPC)High incomeHondurasHong Kong SAR, ChinaHungaryIBRD onlyIcelandIDA & IBRD totalIDA blendIDA onlyIDA totalIndiaIndonesiaIran, Islamic Rep.IraqIrelandItalyJamaicaJapanJordanKazakhstanKenyaKiribatiKorea, Rep.KosovoKuwaitKyrgyz RepublicLao PDRLate-demographic dividendLatin America & Caribbean Latin America & Caribbean (excluding high income)Latin America & the Caribbean (IDA & IBRD countries)LatviaLeast developed countries: UN classificationLebanonLesothoLiberiaLithuaniaLow & middle incomeLow incomeLower middle incomeLuxembourgMacedonia, FYRMadagascarMalawiMalaysiaMaldivesMaliMarshall IslandsMauritaniaMauritiusMexicoMicronesia, Fed. Sts.Middle East & North AfricaMiddle East & North Africa (excluding high income)Middle East & North Africa (IDA & IBRD countries)Middle incomeMoldovaMongoliaMontenegroMoroccoMozambiqueMyanmarNamibiaNepalNetherlandsNew ZealandNicaraguaNigerNigeriaNorth AmericaNorwayOECD membersOmanOther small statesPacific island small statesPakistanPalauPanamaPapua New GuineaParaguayPeruPhilippinesPolandPortugalPost-demographic dividendPre-demographic dividendPuerto RicoQatarRomaniaRussian FederationRwandaSamoaSao Tome and PrincipeSaudi ArabiaSenegalSerbiaSeychellesSierra LeoneSingaporeSlovak RepublicSloveniaSmall statesSolomon IslandsSomaliaSouth AfricaSouth AsiaSouth Asia (IDA & IBRD)SpainSri LankaSt. Kitts and NevisSt. LuciaSt. Vincent and the GrenadinesSub-Saharan Africa Sub-Saharan Africa (excluding high income)Sub-Saharan Africa (IDA & IBRD countries)SudanSurinameSwazilandSwedenSwitzerlandSyrian Arab RepublicTajikistanTanzaniaThailandTimor-LesteTogoTongaTrinidad and TobagoTunisiaTurkeyTurkmenistanTuvaluUgandaUkraineUnited Arab EmiratesUnited KingdomUnited StatesUpper middle incomeUruguayUzbekistanVanuatuVenezuela, RBVietnamWest Bank and GazaWorldZambiaZimbabwe La ligne de temps
Cette échelle de temps montre un graphique de 1970 année à 2016 année Turkey. Les données jusqu'à 1969 année ne sont pas présentés. Quantité d'observations actuelles selon dates: 47.
Source (désignation):
Les indicateurs du développement mondiale
Source (organisation):
World Bank national accounts data, and OECD National Accounts data files.
Catégories:
Economy & Growth
Dernière mise à jour
23 avr. 2017
Les indicateurs de changement de valeurs selon les années
Minimum:
-8.988
1 janv. 2002
Maximum:
13.88
1 janv. 2011
Pour la date d''observation
Valeur
Changement absolu
Le changement par rapport à la valeur précédente
1 janv. 1970
9.315
+9.315
0.0%
1 janv. 1971
3.702
-5.613
-60.26%
1 janv. 1972
6.149
+2.446
66.08%
1 janv. 1973
10.468
+4.319
70.24%
1 janv. 1974
11.142
+0.674
6.44%
1 janv. 1975
5.808
-5.334
-47.87%
1 janv. 1976
7.274
+1.466
25.25%
1 janv. 1977
9.807
+2.532
34.81%
1 janv. 1978
5.359
-4.448
-45.35%
1 janv. 1979
-0.829
-6.188
-115.47%
1 janv. 1980
-3.436
-2.607
314.45%
1 janv. 1981
-0.966
+2.47
-71.9%
1 janv. 1982
7.637
+8.602
-890.94%
1 janv. 1983
1.958
-5.678
-74.36%
1 janv. 1984
8.328
+6.37
325.25%
1 janv. 1985
10.261
+1.933
23.21%
1 janv. 1986
7.713
-2.549
-24.84%
1 janv. 1987
11.052
+3.339
43.3%
1 janv. 1988
10.331
-0.721
-6.52%
1 janv. 1989
0.201
-10.129
-98.05%
1 janv. 1990
4.937
+4.735
2.35 milles%
1 janv. 1991
6.589
+1.652
33.47%
1 janv. 1992
2.41
-4.179
-63.43%
1 janv. 1993
5.995
+3.585
148.77%
1 janv. 1994
8.141
+2.146
35.8%
1 janv. 1995
-4.956
-13.097
-160.88%
1 janv. 1996
8.745
+13.701
-276.46%
1 janv. 1997
6.9
-1.845
-21.1%
1 janv. 1998
9.467
+2.567
37.2%
1 janv. 1999
1.797
-7.67
-81.01%
1 janv. 2000
-4.634
-6.432
-357.83%
1 janv. 2001
6.232
+10.867
-234.48%
1 janv. 2002
-8.988
-15.22
-244.22%
1 janv. 2003
4.714
+13.702
-152.45%
1 janv. 2004
7.668
+2.954
62.67%
1 janv. 2005
11.629
+3.961
51.65%
1 janv. 2006
8.816
-2.813
-24.19%
1 janv. 2007
10.24
+1.424
16.15%
1 janv. 2008
5.764
-4.476
-43.71%
1 janv. 2009
-1.307
-7.071
-122.67%
1 janv. 2010
-8.604
-7.298
558.55%
1 janv. 2011
13.88
+22.484
-261.31%
1 janv. 2012
10.03
-3.85
-27.74%
1 janv. 2013
1.599
-8.431
-84.06%
1 janv. 2014
4.078
+2.479
155.01%
1 janv. 2015
3.532
-0.546
-13.39%
1 janv. 2016
3.331
-0.2
-5.68%
Classement des pays selon les statistiques actuelles par années


Commentaires: