29
/fr/
fr
AIzaSyAYiBZKx7MnpbEhh9jyipgxe19OcubqV5w
April 1, 2024
62874
World
WLD
false
2
1
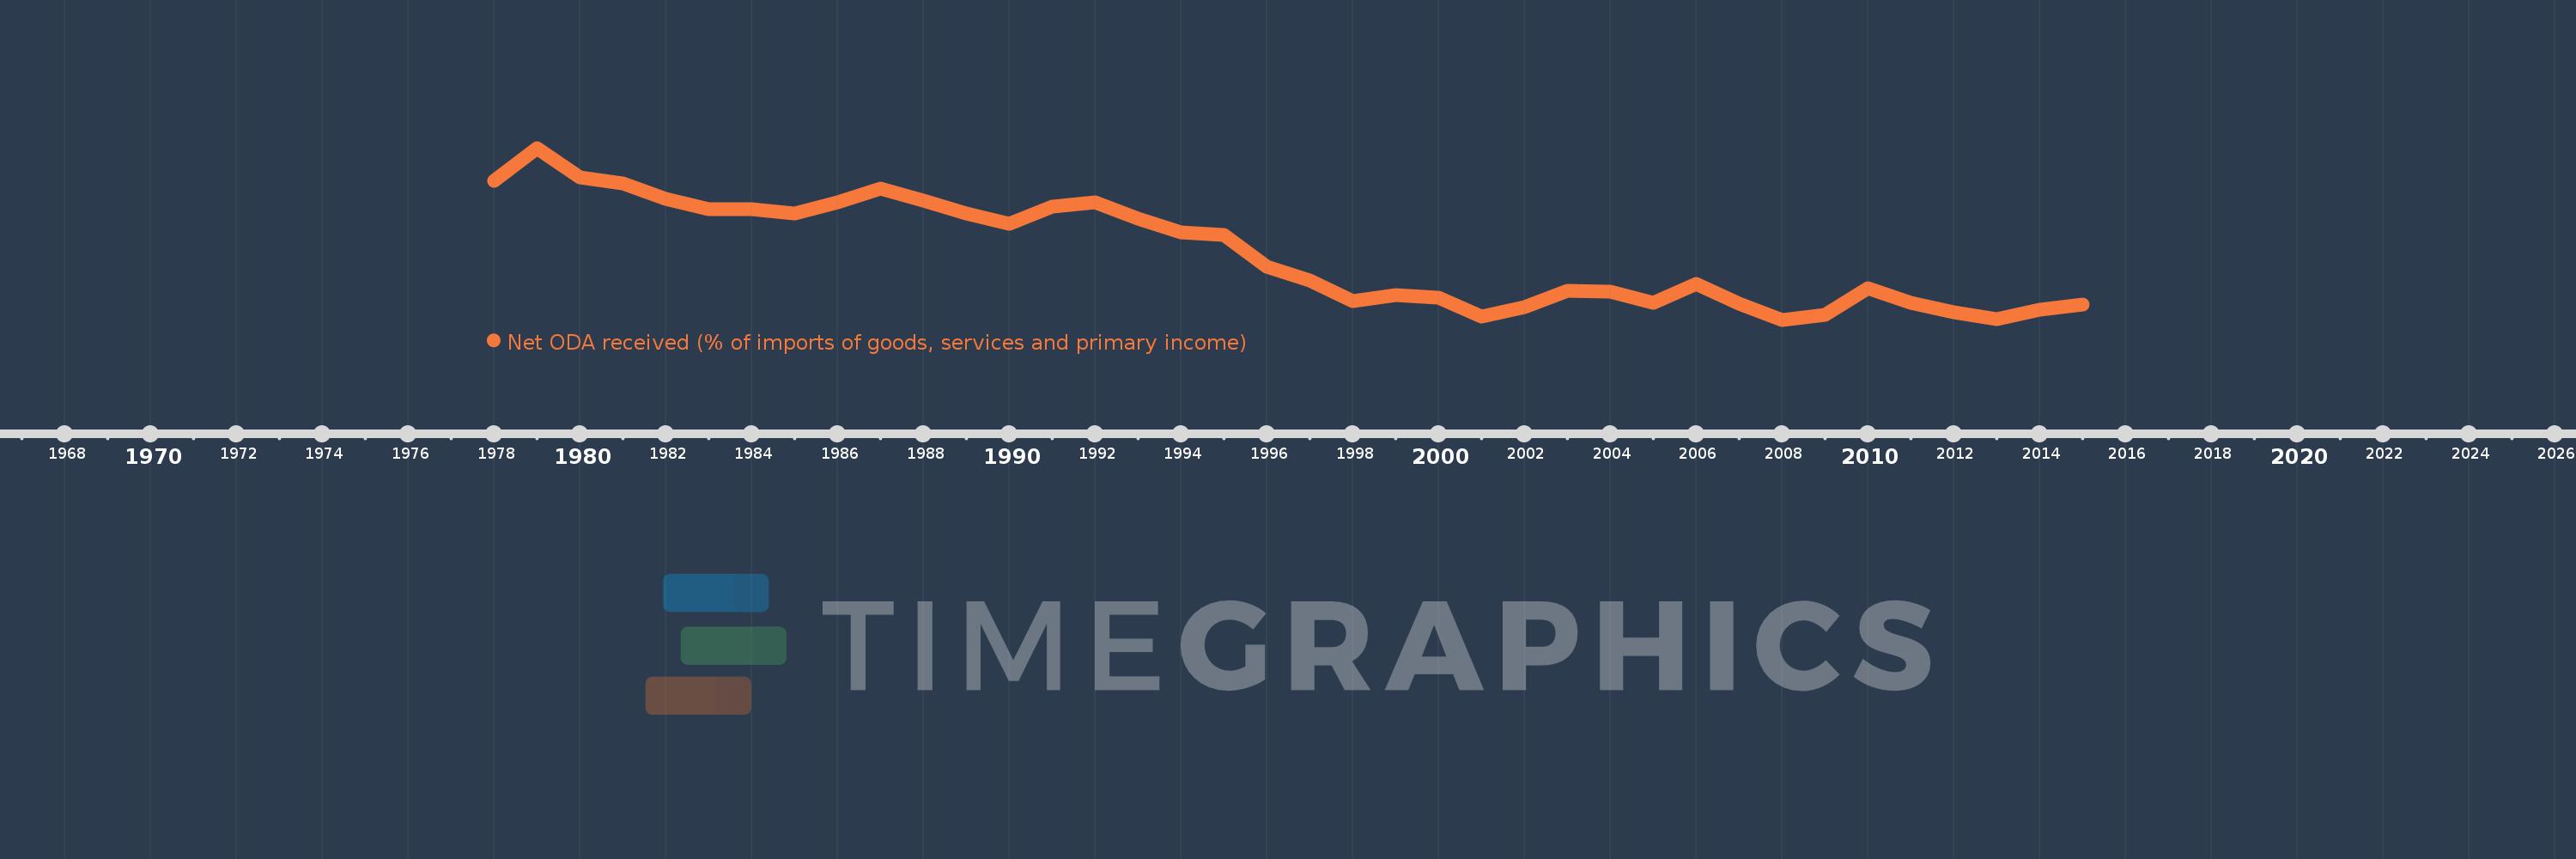
Net ODA received (% of imports of goods, services and primary income)
2015,2014,2013,2012,2011,2010,2009,2008,2007,2006,2005,2004,2003,2002,2001,2000,1999,1998,1997,1996,1995,1994,1993,1992,1991,1990,1989,1988,1987,1986,1985,1984,1983,1982,1981,1980,1979,1978
Cette statistique dans les autres pays:
AfghanistanAlbaniaAlgeriaAngolaAntigua and BarbudaArab WorldArgentinaArmeniaArubaAzerbaijanBahamas, TheBahrainBangladeshBarbadosBelarusBelizeBeninBhutanBoliviaBosnia and HerzegovinaBotswanaBrazilBurkina FasoBurundiCabo VerdeCambodiaCameroonCaribbean small statesCentral African RepublicCentral Europe and the BalticsChadChileChinaColombiaComorosCongo, Dem. Rep.Congo, Rep.Costa RicaCote d'IvoireCroatiaCyprusDjiboutiDominicaDominican RepublicEast Asia & PacificEast Asia & Pacific (excluding high income)East Asia & Pacific (IDA & IBRD countries)EcuadorEgypt, Arab Rep.El SalvadorEquatorial GuineaEritreaEthiopiaEuro areaEurope & Central AsiaEurope & Central Asia (excluding high income)Europe & Central Asia (IDA & IBRD countries)European UnionFijiFragile and conflict affected situationsGabonGambia, TheGeorgiaGhanaGrenadaGuatemalaGuineaGuinea-BissauGuyanaHaitiHeavily indebted poor countries (HIPC)High incomeHondurasIBRD onlyIDA & IBRD totalIDA blendIDA onlyIDA totalIndiaIndonesiaIran, Islamic Rep.IraqIsraelJamaicaJordanKazakhstanKenyaKiribatiKorea, Rep.KosovoKuwaitKyrgyz RepublicLao PDRLatin America & Caribbean Latin America & Caribbean (excluding high income)Latin America & the Caribbean (IDA & IBRD countries)Least developed countries: UN classificationLebanonLesothoLiberiaLibyaLow & middle incomeLow incomeLower middle incomeMacedonia, FYRMadagascarMalawiMalaysiaMaldivesMaliMaltaMarshall IslandsMauritaniaMauritiusMexicoMicronesia, Fed. Sts.Middle East & North Africa (excluding high income)Middle East & North Africa (IDA & IBRD countries)Middle incomeMoldovaMongoliaMontenegroMoroccoMozambiqueMyanmarNamibiaNepalNicaraguaNigerNigeriaNorth AmericaOECD membersOmanOther small statesPacific island small statesPakistanPalauPanamaPapua New GuineaParaguayPeruPhilippinesRwandaSamoaSao Tome and PrincipeSaudi ArabiaSenegalSerbiaSeychellesSierra LeoneSingaporeSloveniaSmall statesSolomon IslandsSouth AfricaSouth AsiaSouth Asia (IDA & IBRD)South SudanSri LankaSt. Kitts and NevisSt. LuciaSt. Vincent and the GrenadinesSub-Saharan Africa Sub-Saharan Africa (excluding high income)Sub-Saharan Africa (IDA & IBRD countries)SudanSurinameSwazilandSyrian Arab RepublicTajikistanTanzaniaThailandTimor-LesteTogoTongaTrinidad and TobagoTunisiaTurkeyTuvaluUgandaUkraineUpper middle incomeUruguayVanuatuVenezuela, RBVietnamWest Bank and GazaWorldYemen, Rep.ZambiaZimbabwe La ligne de temps
Cette échelle de temps montre un graphique de 1978 année à 2015 année World. Les données jusqu'à 1977 année ne sont pas présentés. Quantité d'observations actuelles selon dates: 38.
Source (désignation):
Les indicateurs du développement mondiale
Source (organisation):
Development Assistance Committee of the Organisation for Economic Co-operation and Development, Geographical Distribution of Financial Flows to Developing Countries, Development Co-operation Report, and International Development Statistics database. Data are available online at: www.oecd.org/dac/stats/idsonline. World Bank imports of good and services estimates are used for the denominator.
Catégories:
Aid Effectiveness
Dernière mise à jour
23 avr. 2017
Les indicateurs de changement de valeurs selon les années
Minimum:
0.508
1 janv. 2008
Maximum:
1.442
1 janv. 1979
Pour la date d''observation
Valeur
Changement absolu
Le changement par rapport à la valeur précédente
1 janv. 1978
1.261
+1.261
0.0%
1 janv. 1979
1.442
+0.181
14.32%
1 janv. 1980
1.282
-0.16
-11.07%
1 janv. 1981
1.251
-0.031
-2.41%
1 janv. 1982
1.163
-0.088
-7.01%
1 janv. 1983
1.111
-0.053
-4.55%
1 janv. 1984
1.108
-0.002
-0.18%
1 janv. 1985
1.086
-0.022
-2.0%
1 janv. 1986
1.146
+0.06
5.53%
1 janv. 1987
1.221
+0.075
6.5%
1 janv. 1988
1.154
-0.067
-5.5%
1 janv. 1989
1.087
-0.066
-5.76%
1 janv. 1990
1.03
-0.058
-5.29%
1 janv. 1991
1.122
+0.092
8.94%
1 janv. 1992
1.147
+0.025
2.27%
1 janv. 1993
1.056
-0.091
-7.97%
1 janv. 1994
0.985
-0.071
-6.68%
1 janv. 1995
0.968
-0.017
-1.7%
1 janv. 1996
0.798
-0.171
-17.63%
1 janv. 1997
0.72
-0.078
-9.73%
1 janv. 1998
0.61
-0.11
-15.27%
1 janv. 1999
0.641
+0.031
5.13%
1 janv. 2000
0.627
-0.014
-2.19%
1 janv. 2001
0.524
-0.104
-16.55%
1 janv. 2002
0.575
+0.051
9.79%
1 janv. 2003
0.665
+0.09
15.67%
1 janv. 2004
0.659
-0.005
-0.82%
1 janv. 2005
0.602
-0.057
-8.65%
1 janv. 2006
0.705
+0.103
17.1%
1 janv. 2007
0.596
-0.11
-15.56%
1 janv. 2008
0.508
-0.088
-14.77%
1 janv. 2009
0.533
+0.025
4.98%
1 janv. 2010
0.679
+0.146
27.38%
1 janv. 2011
0.598
-0.081
-11.95%
1 janv. 2012
0.547
-0.051
-8.51%
1 janv. 2013
0.51
-0.037
-6.75%
1 janv. 2014
0.564
+0.054
10.52%
1 janv. 2015
0.59
+0.026
4.59%
Classement des pays selon les statistiques actuelles par années


Commentaires: