29
/fr/
fr
AIzaSyAYiBZKx7MnpbEhh9jyipgxe19OcubqV5w
April 1, 2024
59195
Sub-Saharan Africa
SSF
false
2
1
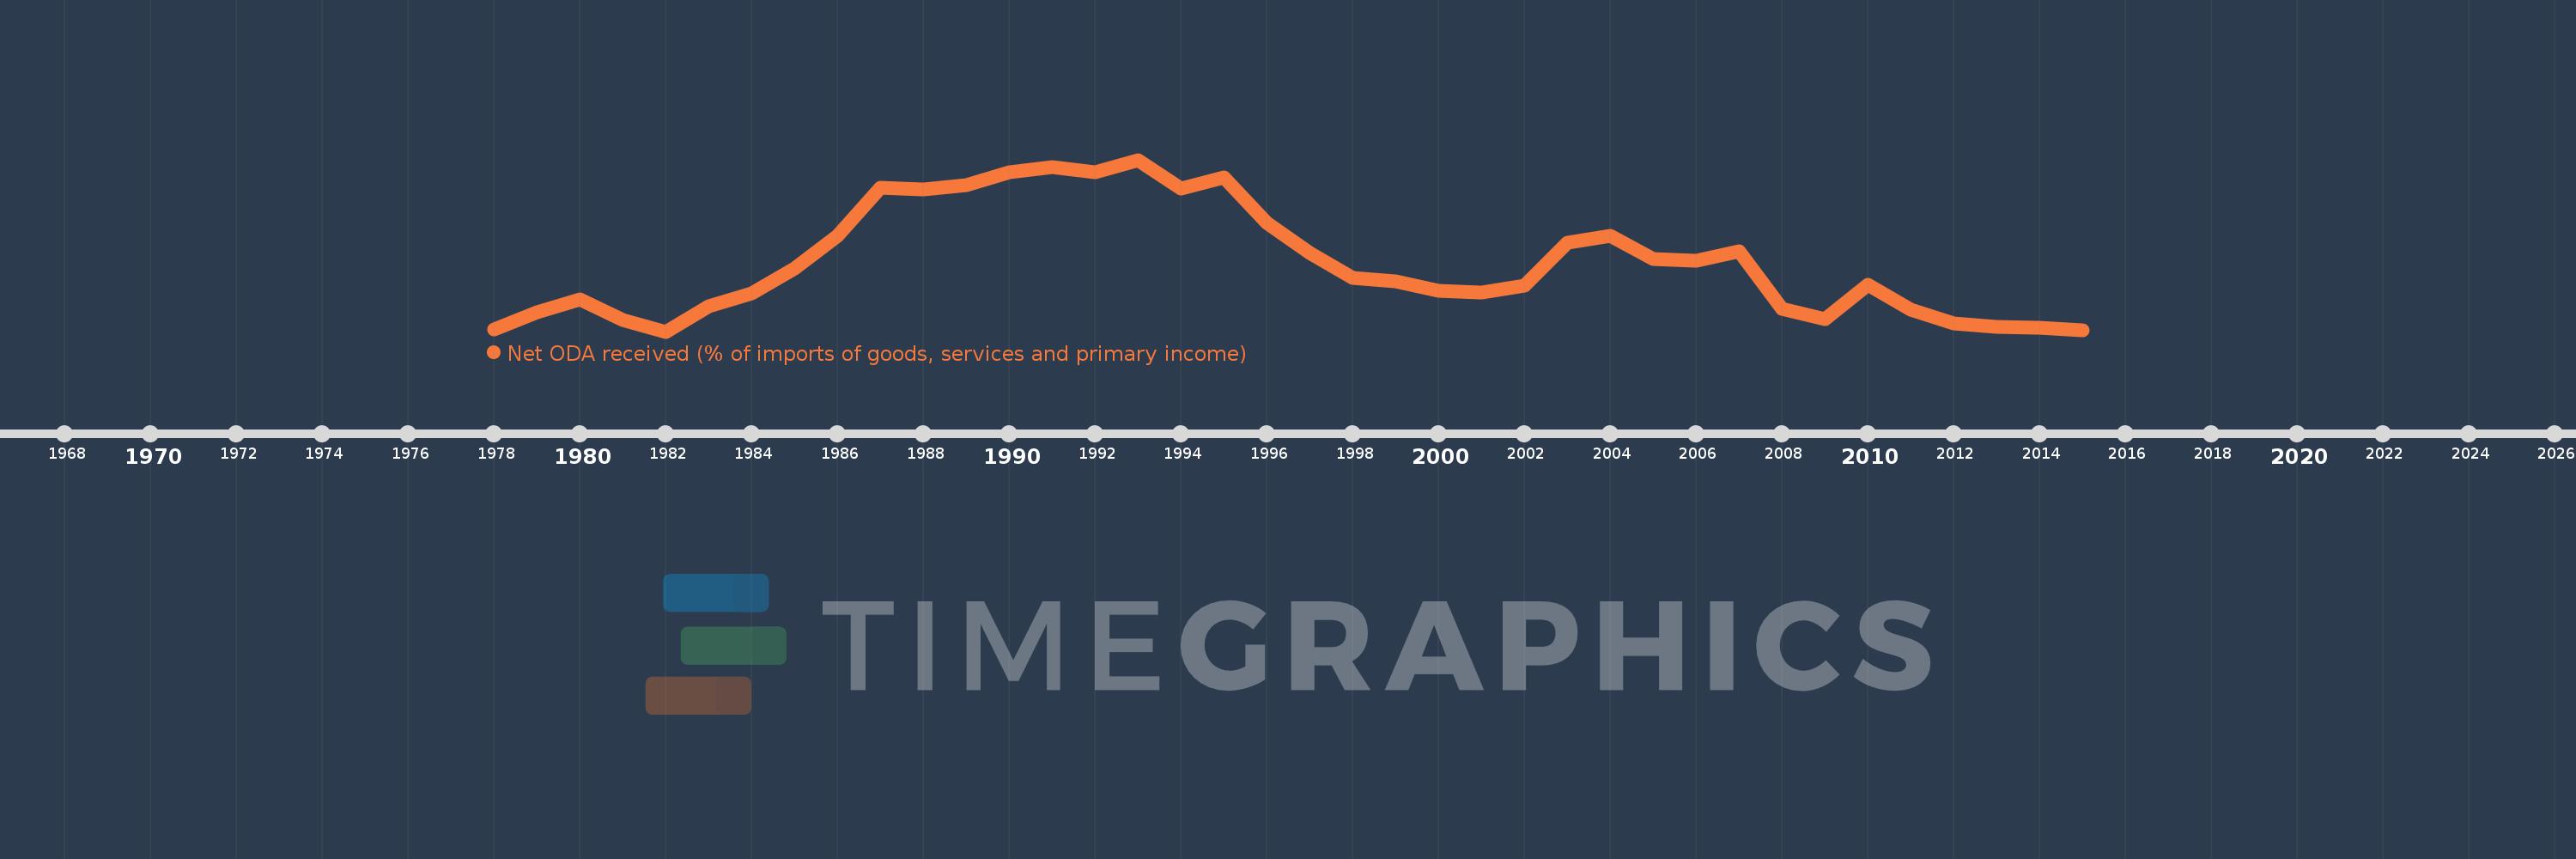
Net ODA received (% of imports of goods, services and primary income)
2015,2014,2013,2012,2011,2010,2009,2008,2007,2006,2005,2004,2003,2002,2001,2000,1999,1998,1997,1996,1995,1994,1993,1992,1991,1990,1989,1988,1987,1986,1985,1984,1983,1982,1981,1980,1979,1978
Cette statistique dans les autres pays:
AfghanistanAlbaniaAlgeriaAngolaAntigua and BarbudaArab WorldArgentinaArmeniaArubaAzerbaijanBahamas, TheBahrainBangladeshBarbadosBelarusBelizeBeninBhutanBoliviaBosnia and HerzegovinaBotswanaBrazilBurkina FasoBurundiCabo VerdeCambodiaCameroonCaribbean small statesCentral African RepublicCentral Europe and the BalticsChadChileChinaColombiaComorosCongo, Dem. Rep.Congo, Rep.Costa RicaCote d'IvoireCroatiaCyprusDjiboutiDominicaDominican RepublicEast Asia & PacificEast Asia & Pacific (excluding high income)East Asia & Pacific (IDA & IBRD countries)EcuadorEgypt, Arab Rep.El SalvadorEquatorial GuineaEritreaEthiopiaEuro areaEurope & Central AsiaEurope & Central Asia (excluding high income)Europe & Central Asia (IDA & IBRD countries)European UnionFijiFragile and conflict affected situationsGabonGambia, TheGeorgiaGhanaGrenadaGuatemalaGuineaGuinea-BissauGuyanaHaitiHeavily indebted poor countries (HIPC)High incomeHondurasIBRD onlyIDA & IBRD totalIDA blendIDA onlyIDA totalIndiaIndonesiaIran, Islamic Rep.IraqIsraelJamaicaJordanKazakhstanKenyaKiribatiKorea, Rep.KosovoKuwaitKyrgyz RepublicLao PDRLatin America & Caribbean Latin America & Caribbean (excluding high income)Latin America & the Caribbean (IDA & IBRD countries)Least developed countries: UN classificationLebanonLesothoLiberiaLibyaLow & middle incomeLow incomeLower middle incomeMacedonia, FYRMadagascarMalawiMalaysiaMaldivesMaliMaltaMarshall IslandsMauritaniaMauritiusMexicoMicronesia, Fed. Sts.Middle East & North Africa (excluding high income)Middle East & North Africa (IDA & IBRD countries)Middle incomeMoldovaMongoliaMontenegroMoroccoMozambiqueMyanmarNamibiaNepalNicaraguaNigerNigeriaNorth AmericaOECD membersOmanOther small statesPacific island small statesPakistanPalauPanamaPapua New GuineaParaguayPeruPhilippinesRwandaSamoaSao Tome and PrincipeSaudi ArabiaSenegalSerbiaSeychellesSierra LeoneSingaporeSloveniaSmall statesSolomon IslandsSouth AfricaSouth AsiaSouth Asia (IDA & IBRD)South SudanSri LankaSt. Kitts and NevisSt. LuciaSt. Vincent and the GrenadinesSub-Saharan Africa Sub-Saharan Africa (excluding high income)Sub-Saharan Africa (IDA & IBRD countries)SudanSurinameSwazilandSyrian Arab RepublicTajikistanTanzaniaThailandTimor-LesteTogoTongaTrinidad and TobagoTunisiaTurkeyTuvaluUgandaUkraineUpper middle incomeUruguayVanuatuVenezuela, RBVietnamWest Bank and GazaWorldYemen, Rep.ZambiaZimbabwe La ligne de temps
Cette échelle de temps montre un graphique de 1978 année à 2015 année Sub-Saharan Africa . Les données jusqu'à 1977 année ne sont pas présentés. Quantité d'observations actuelles selon dates: 38.
Source (désignation):
Les indicateurs du développement mondiale
Source (organisation):
Development Assistance Committee of the Organisation for Economic Co-operation and Development, Geographical Distribution of Financial Flows to Developing Countries, Development Co-operation Report, and International Development Statistics database. Data are available online at: www.oecd.org/dac/stats/idsonline. World Bank imports of good and services estimates are used for the denominator.
Catégories:
Aid Effectiveness
Dernière mise à jour
23 avr. 2017
Les indicateurs de changement de valeurs selon les années
Minimum:
7.648
1 janv. 1982
Maximum:
21.263
1 janv. 1993
Pour la date d''observation
Valeur
Changement absolu
Le changement par rapport à la valeur précédente
1 janv. 1978
7.797
+7.797
0.0%
1 janv. 1979
9.195
+1.398
17.93%
1 janv. 1980
10.209
+1.014
11.03%
1 janv. 1981
8.582
-1.627
-15.93%
1 janv. 1982
7.648
-0.934
-10.88%
1 janv. 1983
9.645
+1.997
26.1%
1 janv. 1984
10.706
+1.061
11.0%
1 janv. 1985
12.68
+1.974
18.44%
1 janv. 1986
15.24
+2.56
20.18%
1 janv. 1987
19.035
+3.795
24.9%
1 janv. 1988
18.92
-0.115
-0.6%
1 janv. 1989
19.269
+0.349
1.85%
1 janv. 1990
20.298
+1.029
5.34%
1 janv. 1991
20.686
+0.388
1.91%
1 janv. 1992
20.26
-0.426
-2.06%
1 janv. 1993
21.263
+1.003
4.95%
1 janv. 1994
18.968
-2.294
-10.79%
1 janv. 1995
19.849
+0.881
4.64%
1 janv. 1996
16.268
-3.582
-18.04%
1 janv. 1997
13.887
-2.381
-14.64%
1 janv. 1998
11.871
-2.016
-14.51%
1 janv. 1999
11.648
-0.223
-1.88%
1 janv. 2000
10.898
-0.75
-6.44%
1 janv. 2001
10.762
-0.136
-1.25%
1 janv. 2002
11.292
+0.531
4.93%
1 janv. 2003
14.686
+3.394
30.05%
1 janv. 2004
15.268
+0.582
3.96%
1 janv. 2005
13.425
-1.844
-12.07%
1 janv. 2006
13.26
-0.165
-1.23%
1 janv. 2007
13.982
+0.722
5.44%
1 janv. 2008
9.461
-4.521
-32.33%
1 janv. 2009
8.602
-0.859
-9.08%
1 janv. 2010
11.327
+2.724
31.67%
1 janv. 2011
9.398
-1.929
-17.03%
1 janv. 2012
8.32
-1.079
-11.48%
1 janv. 2013
7.997
-0.322
-3.87%
1 janv. 2014
7.953
-0.044
-0.56%
1 janv. 2015
7.781
-0.172
-2.16%
Classement des pays selon les statistiques actuelles par années


Commentaires: