29
/fr/
fr
AIzaSyAYiBZKx7MnpbEhh9jyipgxe19OcubqV5w
April 1, 2024
251114
St. Lucia
LCA
true
2
1
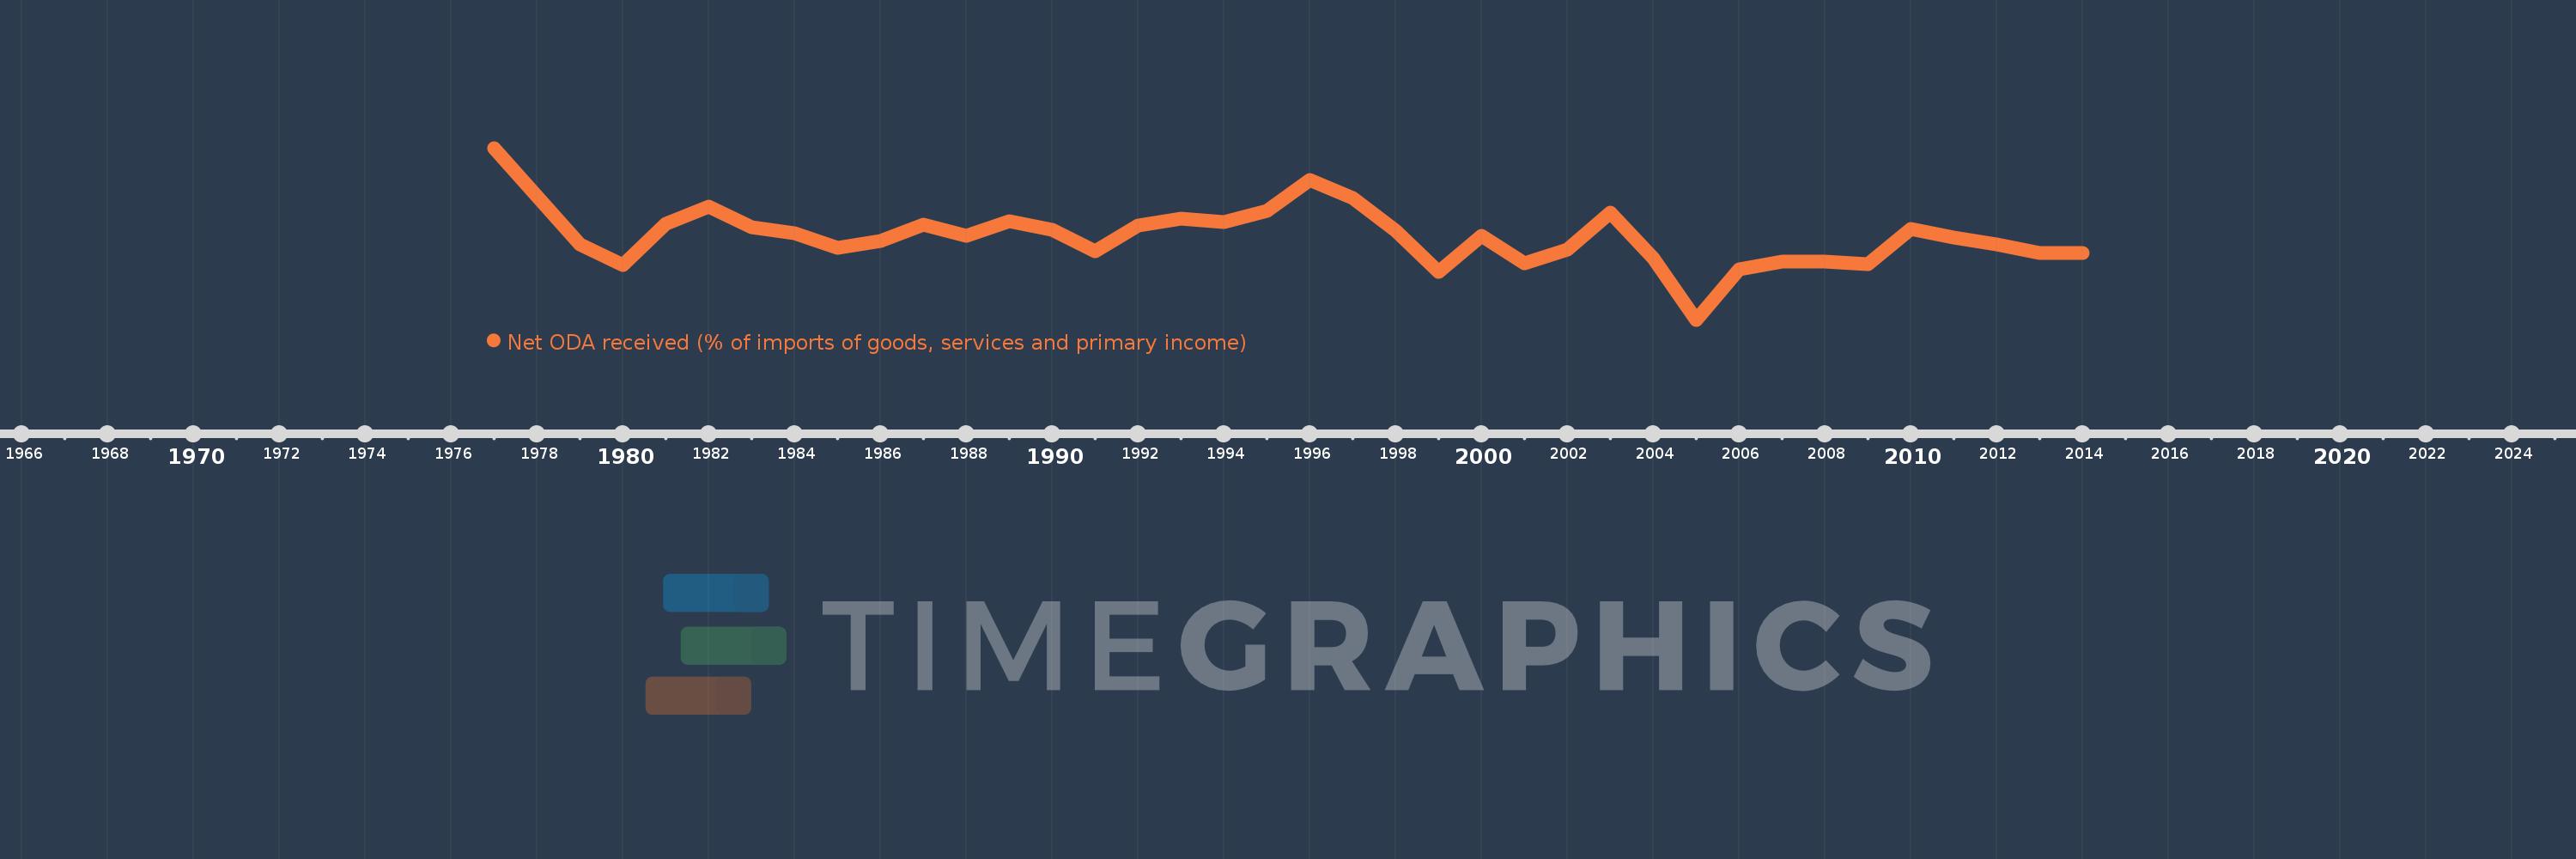
Net ODA received (% of imports of goods, services and primary income)
2014,2013,2012,2011,2010,2009,2008,2007,2006,2005,2004,2003,2002,2001,2000,1999,1998,1997,1996,1995,1994,1993,1992,1991,1990,1989,1988,1987,1986,1985,1984,1983,1982,1981,1980,1979,1977
Cette statistique dans les autres pays:
AfghanistanAlbaniaAlgeriaAngolaAntigua and BarbudaArab WorldArgentinaArmeniaArubaAzerbaijanBahamas, TheBahrainBangladeshBarbadosBelarusBelizeBeninBhutanBoliviaBosnia and HerzegovinaBotswanaBrazilBurkina FasoBurundiCabo VerdeCambodiaCameroonCaribbean small statesCentral African RepublicCentral Europe and the BalticsChadChileChinaColombiaComorosCongo, Dem. Rep.Congo, Rep.Costa RicaCote d'IvoireCroatiaCyprusDjiboutiDominicaDominican RepublicEast Asia & PacificEast Asia & Pacific (excluding high income)East Asia & Pacific (IDA & IBRD countries)EcuadorEgypt, Arab Rep.El SalvadorEquatorial GuineaEritreaEthiopiaEuro areaEurope & Central AsiaEurope & Central Asia (excluding high income)Europe & Central Asia (IDA & IBRD countries)European UnionFijiFragile and conflict affected situationsGabonGambia, TheGeorgiaGhanaGrenadaGuatemalaGuineaGuinea-BissauGuyanaHaitiHeavily indebted poor countries (HIPC)High incomeHondurasIBRD onlyIDA & IBRD totalIDA blendIDA onlyIDA totalIndiaIndonesiaIran, Islamic Rep.IraqIsraelJamaicaJordanKazakhstanKenyaKiribatiKorea, Rep.KosovoKuwaitKyrgyz RepublicLao PDRLatin America & Caribbean Latin America & Caribbean (excluding high income)Latin America & the Caribbean (IDA & IBRD countries)Least developed countries: UN classificationLebanonLesothoLiberiaLibyaLow & middle incomeLow incomeLower middle incomeMacedonia, FYRMadagascarMalawiMalaysiaMaldivesMaliMaltaMarshall IslandsMauritaniaMauritiusMexicoMicronesia, Fed. Sts.Middle East & North Africa (excluding high income)Middle East & North Africa (IDA & IBRD countries)Middle incomeMoldovaMongoliaMontenegroMoroccoMozambiqueMyanmarNamibiaNepalNicaraguaNigerNigeriaNorth AmericaOECD membersOmanOther small statesPacific island small statesPakistanPalauPanamaPapua New GuineaParaguayPeruPhilippinesRwandaSamoaSao Tome and PrincipeSaudi ArabiaSenegalSerbiaSeychellesSierra LeoneSingaporeSloveniaSmall statesSolomon IslandsSouth AfricaSouth AsiaSouth Asia (IDA & IBRD)South SudanSri LankaSt. Kitts and NevisSt. LuciaSt. Vincent and the GrenadinesSub-Saharan Africa Sub-Saharan Africa (excluding high income)Sub-Saharan Africa (IDA & IBRD countries)SudanSurinameSwazilandSyrian Arab RepublicTajikistanTanzaniaThailandTimor-LesteTogoTongaTrinidad and TobagoTunisiaTurkeyTuvaluUgandaUkraineUpper middle incomeUruguayVanuatuVenezuela, RBVietnamWest Bank and GazaWorldYemen, Rep.ZambiaZimbabwe La ligne de temps
Cette échelle de temps montre un graphique de 1977 année à 2014 année St. Lucia. Les données jusqu'à 1976 année ne sont pas présentés. Quantité d'observations actuelles selon dates: 37.
Source (désignation):
Les indicateurs du développement mondiale
Source (organisation):
Development Assistance Committee of the Organisation for Economic Co-operation and Development, Geographical Distribution of Financial Flows to Developing Countries, Development Co-operation Report, and International Development Statistics database. Data are available online at: www.oecd.org/dac/stats/idsonline. World Bank imports of good and services estimates are used for the denominator.
Catégories:
Aid Effectiveness
Dernière mise à jour
23 avr. 2017
Les indicateurs de changement de valeurs selon les années
Minimum:
-3.705
1 janv. 2005
Maximum:
14.267
1 janv. 1977
Pour la date d''observation
Valeur
Changement absolu
Le changement par rapport à la valeur précédente
1 janv. 1977
14.267
+14.267
0.0%
1 janv. 1979
4.187
-10.08
-70.65%
1 janv. 1980
2.009
-2.178
-52.01%
1 janv. 1981
6.374
+4.364
217.19%
1 janv. 1982
8.102
+1.728
27.11%
1 janv. 1983
5.987
-2.115
-26.1%
1 janv. 1984
5.358
-0.629
-10.51%
1 janv. 1985
3.787
-1.571
-29.32%
1 janv. 1986
4.506
+0.719
18.99%
1 janv. 1987
6.213
+1.707
37.88%
1 janv. 1988
5.043
-1.17
-18.83%
1 janv. 1989
6.619
+1.576
31.25%
1 janv. 1990
5.681
-0.938
-14.17%
1 janv. 1991
3.496
-2.185
-38.46%
1 janv. 1992
6.145
+2.649
75.78%
1 janv. 1993
6.877
+0.732
11.91%
1 janv. 1994
6.538
-0.339
-4.93%
1 janv. 1995
7.718
+1.181
18.06%
1 janv. 1996
10.945
+3.226
41.8%
1 janv. 1997
9.025
-1.92
-17.54%
1 janv. 1998
5.612
-3.412
-37.81%
1 janv. 1999
1.29
-4.323
-77.02%
1 janv. 2000
5.11
+3.821
296.19%
1 janv. 2001
2.222
-2.889
-56.53%
1 janv. 2002
3.652
+1.431
64.4%
1 janv. 2003
7.544
+3.892
106.55%
1 janv. 2004
2.778
-4.766
-63.17%
1 janv. 2005
-3.705
-6.483
-233.35%
1 janv. 2006
1.553
+5.258
-141.92%
1 janv. 2007
2.387
+0.834
53.73%
1 janv. 2008
2.348
-0.039
-1.63%
1 janv. 2009
2.12
-0.228
-9.72%
1 janv. 2010
5.773
+3.653
172.31%
1 janv. 2011
4.872
-0.902
-15.62%
1 janv. 2012
4.152
-0.719
-14.77%
1 janv. 2013
3.307
-0.846
-20.37%
1 janv. 2014
3.305
-0.002
-0.06%
Classement des pays selon les statistiques actuelles par années


Commentaires: