29
/fr/
fr
AIzaSyAYiBZKx7MnpbEhh9jyipgxe19OcubqV5w
April 1, 2024
47448
Lower middle income
LMC
false
2
1
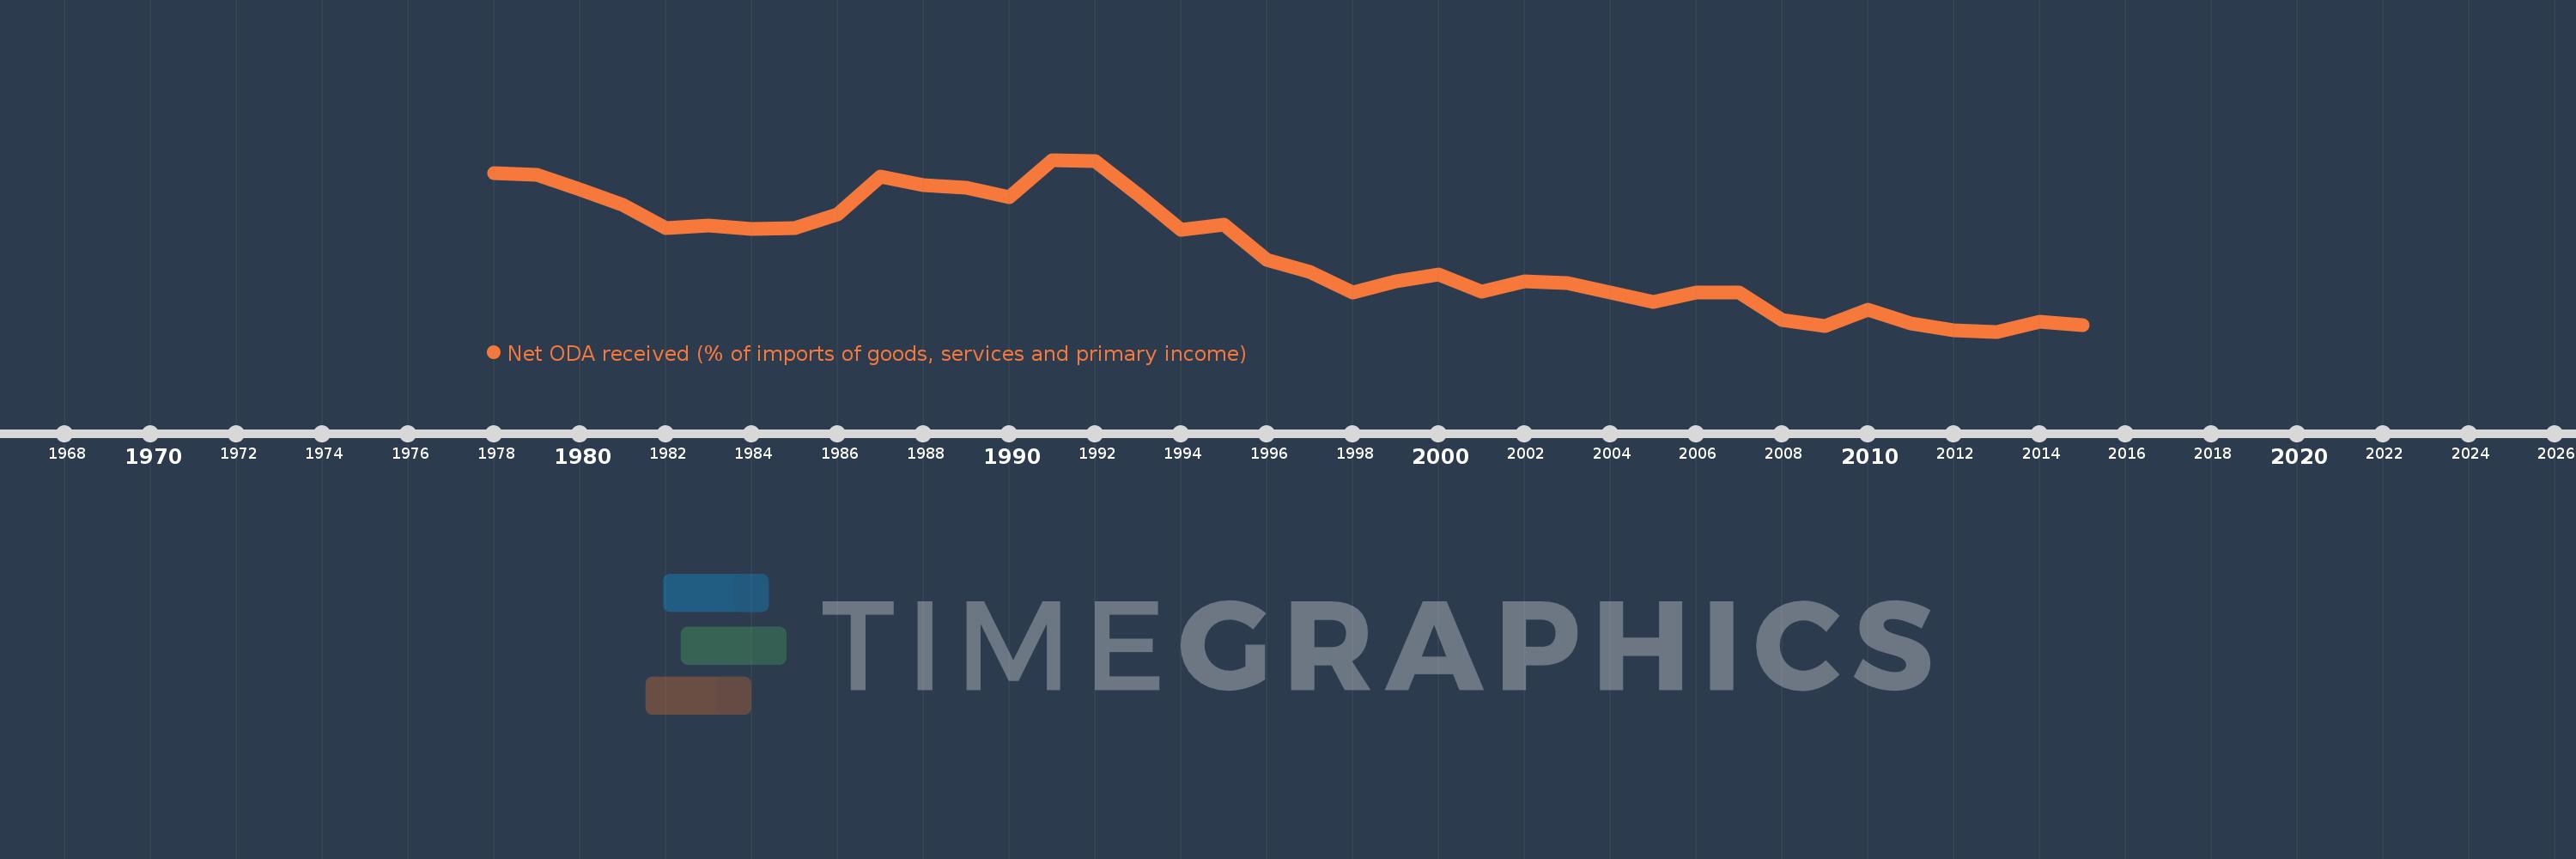
Net ODA received (% of imports of goods, services and primary income)
2015,2014,2013,2012,2011,2010,2009,2008,2007,2006,2005,2004,2003,2002,2001,2000,1999,1998,1997,1996,1995,1994,1993,1992,1991,1990,1989,1988,1987,1986,1985,1984,1983,1982,1981,1980,1979,1978
Cette statistique dans les autres pays:
AfghanistanAlbaniaAlgeriaAngolaAntigua and BarbudaArab WorldArgentinaArmeniaArubaAzerbaijanBahamas, TheBahrainBangladeshBarbadosBelarusBelizeBeninBhutanBoliviaBosnia and HerzegovinaBotswanaBrazilBurkina FasoBurundiCabo VerdeCambodiaCameroonCaribbean small statesCentral African RepublicCentral Europe and the BalticsChadChileChinaColombiaComorosCongo, Dem. Rep.Congo, Rep.Costa RicaCote d'IvoireCroatiaCyprusDjiboutiDominicaDominican RepublicEast Asia & PacificEast Asia & Pacific (excluding high income)East Asia & Pacific (IDA & IBRD countries)EcuadorEgypt, Arab Rep.El SalvadorEquatorial GuineaEritreaEthiopiaEuro areaEurope & Central AsiaEurope & Central Asia (excluding high income)Europe & Central Asia (IDA & IBRD countries)European UnionFijiFragile and conflict affected situationsGabonGambia, TheGeorgiaGhanaGrenadaGuatemalaGuineaGuinea-BissauGuyanaHaitiHeavily indebted poor countries (HIPC)High incomeHondurasIBRD onlyIDA & IBRD totalIDA blendIDA onlyIDA totalIndiaIndonesiaIran, Islamic Rep.IraqIsraelJamaicaJordanKazakhstanKenyaKiribatiKorea, Rep.KosovoKuwaitKyrgyz RepublicLao PDRLatin America & Caribbean Latin America & Caribbean (excluding high income)Latin America & the Caribbean (IDA & IBRD countries)Least developed countries: UN classificationLebanonLesothoLiberiaLibyaLow & middle incomeLow incomeLower middle incomeMacedonia, FYRMadagascarMalawiMalaysiaMaldivesMaliMaltaMarshall IslandsMauritaniaMauritiusMexicoMicronesia, Fed. Sts.Middle East & North Africa (excluding high income)Middle East & North Africa (IDA & IBRD countries)Middle incomeMoldovaMongoliaMontenegroMoroccoMozambiqueMyanmarNamibiaNepalNicaraguaNigerNigeriaNorth AmericaOECD membersOmanOther small statesPacific island small statesPakistanPalauPanamaPapua New GuineaParaguayPeruPhilippinesRwandaSamoaSao Tome and PrincipeSaudi ArabiaSenegalSerbiaSeychellesSierra LeoneSingaporeSloveniaSmall statesSolomon IslandsSouth AfricaSouth AsiaSouth Asia (IDA & IBRD)South SudanSri LankaSt. Kitts and NevisSt. LuciaSt. Vincent and the GrenadinesSub-Saharan Africa Sub-Saharan Africa (excluding high income)Sub-Saharan Africa (IDA & IBRD countries)SudanSurinameSwazilandSyrian Arab RepublicTajikistanTanzaniaThailandTimor-LesteTogoTongaTrinidad and TobagoTunisiaTurkeyTuvaluUgandaUkraineUpper middle incomeUruguayVanuatuVenezuela, RBVietnamWest Bank and GazaWorldYemen, Rep.ZambiaZimbabwe La ligne de temps
Cette échelle de temps montre un graphique de 1978 année à 2015 année Lower middle income. Les données jusqu'à 1977 année ne sont pas présentés. Quantité d'observations actuelles selon dates: 38.
Source (désignation):
Les indicateurs du développement mondiale
Source (organisation):
Development Assistance Committee of the Organisation for Economic Co-operation and Development, Geographical Distribution of Financial Flows to Developing Countries, Development Co-operation Report, and International Development Statistics database. Data are available online at: www.oecd.org/dac/stats/idsonline. World Bank imports of good and services estimates are used for the denominator.
Catégories:
Aid Effectiveness
Dernière mise à jour
23 avr. 2017
Les indicateurs de changement de valeurs selon les années
Maximum:
13.174
1 janv. 1991
Pour la date d''observation
Valeur
Changement absolu
Le changement par rapport à la valeur précédente
1 janv. 1978
12.347
+12.347
0.0%
1 janv. 1979
12.211
-0.136
-1.1%
1 janv. 1980
11.293
-0.918
-7.52%
1 janv. 1981
10.336
-0.957
-8.47%
1 janv. 1982
8.86
-1.476
-14.28%
1 janv. 1983
9.013
+0.153
1.72%
1 janv. 1984
8.779
-0.235
-2.6%
1 janv. 1985
8.847
+0.068
0.78%
1 janv. 1986
9.704
+0.857
9.69%
1 janv. 1987
12.095
+2.391
24.64%
1 janv. 1988
11.562
-0.533
-4.41%
1 janv. 1989
11.391
-0.171
-1.48%
1 janv. 1990
10.818
-0.574
-5.04%
1 janv. 1991
13.174
+2.357
21.79%
1 janv. 1992
13.119
-0.055
-0.42%
1 janv. 1993
11.0
-2.119
-16.15%
1 janv. 1994
8.758
-2.242
-20.38%
1 janv. 1995
9.061
+0.303
3.46%
1 janv. 1996
6.821
-2.24
-24.72%
1 janv. 1997
6.064
-0.757
-11.09%
1 janv. 1998
4.786
-1.279
-21.09%
1 janv. 1999
5.512
+0.727
15.19%
1 janv. 2000
5.921
+0.409
7.41%
1 janv. 2001
4.848
-1.073
-18.12%
1 janv. 2002
5.494
+0.646
13.32%
1 janv. 2003
5.352
-0.142
-2.59%
1 janv. 2004
4.788
-0.564
-10.54%
1 janv. 2005
4.195
-0.592
-12.37%
1 janv. 2006
4.784
+0.588
14.02%
1 janv. 2007
4.757
-0.027
-0.57%
1 janv. 2008
3.057
-1.699
-35.72%
1 janv. 2009
2.667
-0.39
-12.76%
1 janv. 2010
3.681
+1.014
38.02%
1 janv. 2011
2.844
-0.838
-22.75%
1 janv. 2012
2.378
-0.466
-16.39%
1 janv. 2013
2.31
-0.067
-2.84%
1 janv. 2014
2.915
+0.604
26.17%
1 janv. 2015
2.714
-0.201
-6.88%
Classement des pays selon les statistiques actuelles par années


Commentaires: