29
/fr/
fr
AIzaSyAYiBZKx7MnpbEhh9jyipgxe19OcubqV5w
April 1, 2024
149481
Haiti
HTI
true
2
1
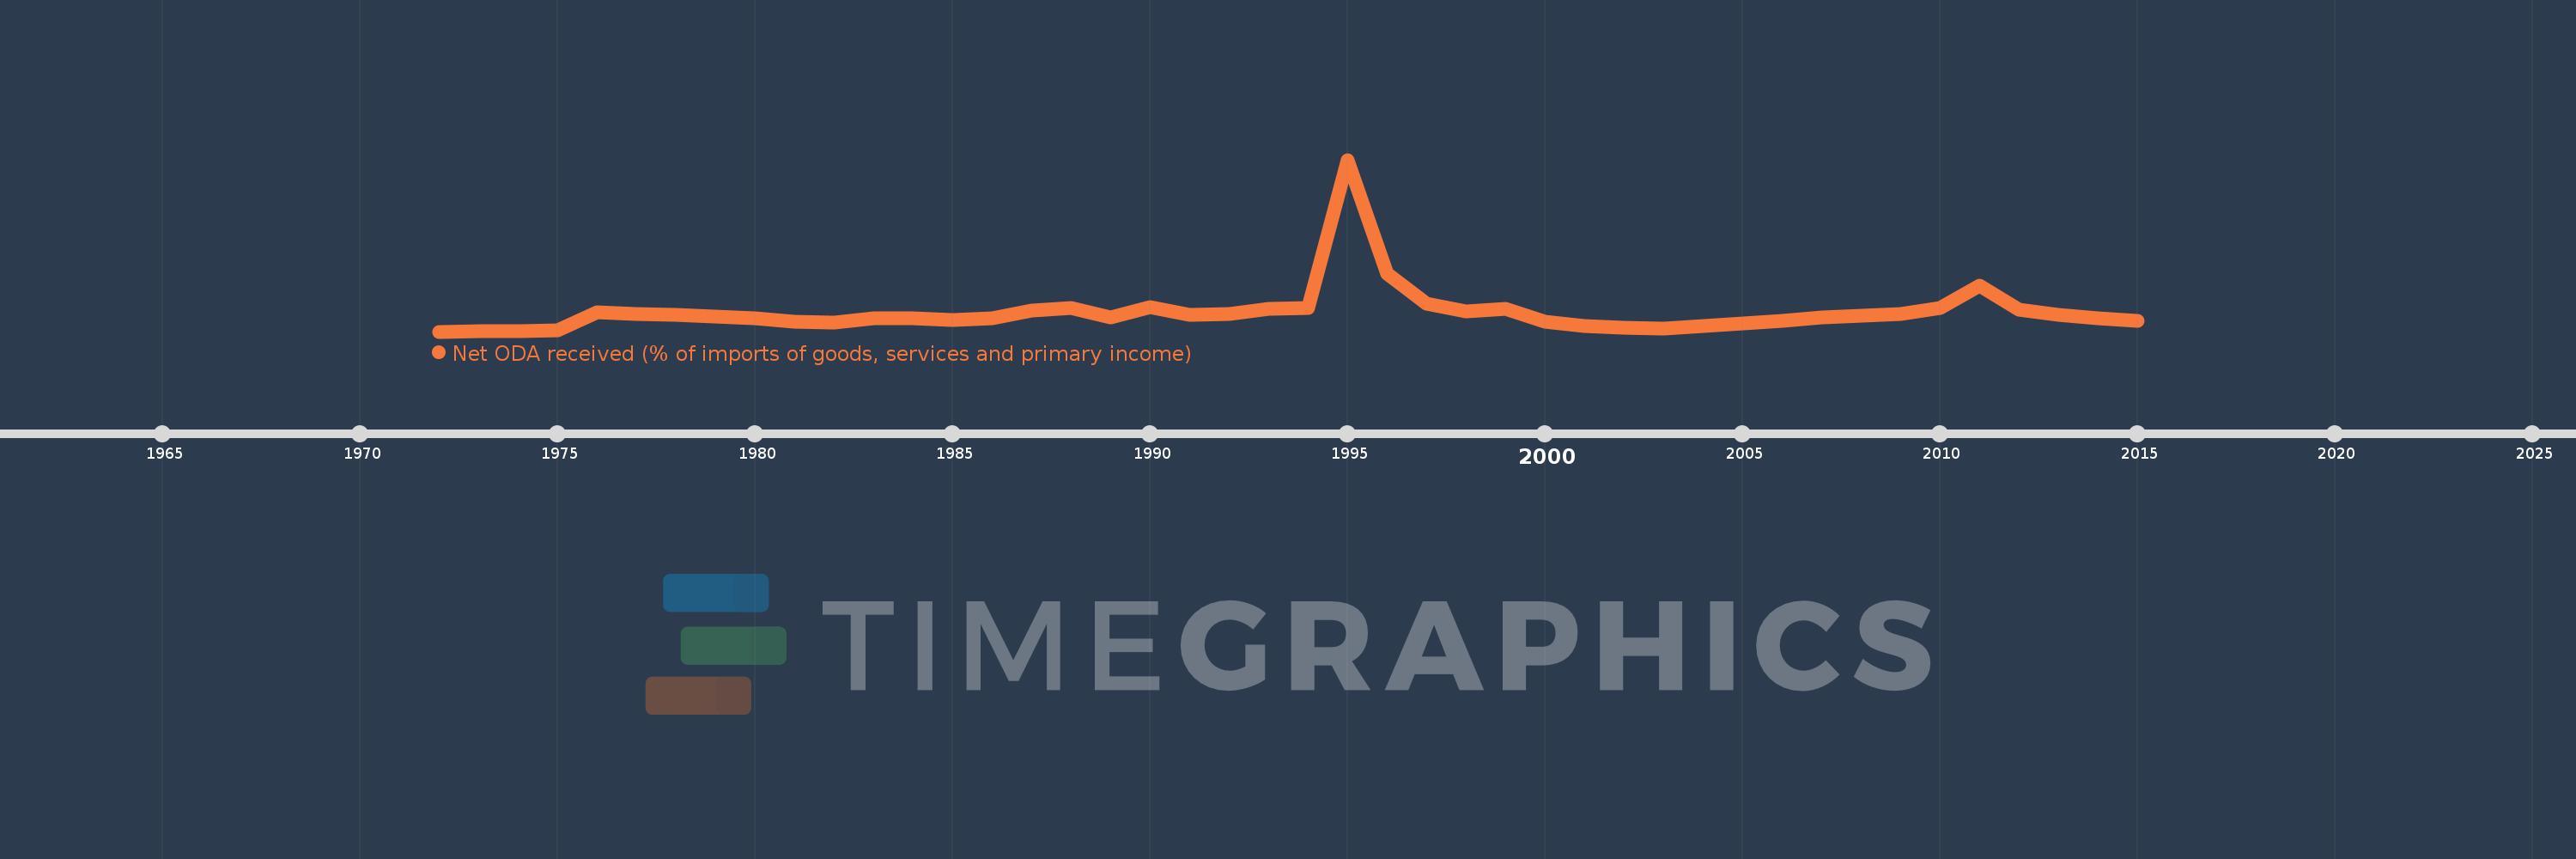
Net ODA received (% of imports of goods, services and primary income)
2015,2014,2013,2012,2011,2010,2009,2008,2007,2006,2005,2004,2003,2002,2001,2000,1999,1998,1997,1996,1995,1994,1993,1992,1991,1990,1989,1988,1987,1986,1985,1984,1983,1982,1981,1980,1979,1978,1977,1976,1975,1974,1973,1972
Cette statistique dans les autres pays:
AfghanistanAlbaniaAlgeriaAngolaAntigua and BarbudaArab WorldArgentinaArmeniaArubaAzerbaijanBahamas, TheBahrainBangladeshBarbadosBelarusBelizeBeninBhutanBoliviaBosnia and HerzegovinaBotswanaBrazilBurkina FasoBurundiCabo VerdeCambodiaCameroonCaribbean small statesCentral African RepublicCentral Europe and the BalticsChadChileChinaColombiaComorosCongo, Dem. Rep.Congo, Rep.Costa RicaCote d'IvoireCroatiaCyprusDjiboutiDominicaDominican RepublicEast Asia & PacificEast Asia & Pacific (excluding high income)East Asia & Pacific (IDA & IBRD countries)EcuadorEgypt, Arab Rep.El SalvadorEquatorial GuineaEritreaEthiopiaEuro areaEurope & Central AsiaEurope & Central Asia (excluding high income)Europe & Central Asia (IDA & IBRD countries)European UnionFijiFragile and conflict affected situationsGabonGambia, TheGeorgiaGhanaGrenadaGuatemalaGuineaGuinea-BissauGuyanaHaitiHeavily indebted poor countries (HIPC)High incomeHondurasIBRD onlyIDA & IBRD totalIDA blendIDA onlyIDA totalIndiaIndonesiaIran, Islamic Rep.IraqIsraelJamaicaJordanKazakhstanKenyaKiribatiKorea, Rep.KosovoKuwaitKyrgyz RepublicLao PDRLatin America & Caribbean Latin America & Caribbean (excluding high income)Latin America & the Caribbean (IDA & IBRD countries)Least developed countries: UN classificationLebanonLesothoLiberiaLibyaLow & middle incomeLow incomeLower middle incomeMacedonia, FYRMadagascarMalawiMalaysiaMaldivesMaliMaltaMarshall IslandsMauritaniaMauritiusMexicoMicronesia, Fed. Sts.Middle East & North Africa (excluding high income)Middle East & North Africa (IDA & IBRD countries)Middle incomeMoldovaMongoliaMontenegroMoroccoMozambiqueMyanmarNamibiaNepalNicaraguaNigerNigeriaNorth AmericaOECD membersOmanOther small statesPacific island small statesPakistanPalauPanamaPapua New GuineaParaguayPeruPhilippinesRwandaSamoaSao Tome and PrincipeSaudi ArabiaSenegalSerbiaSeychellesSierra LeoneSingaporeSloveniaSmall statesSolomon IslandsSouth AfricaSouth AsiaSouth Asia (IDA & IBRD)South SudanSri LankaSt. Kitts and NevisSt. LuciaSt. Vincent and the GrenadinesSub-Saharan Africa Sub-Saharan Africa (excluding high income)Sub-Saharan Africa (IDA & IBRD countries)SudanSurinameSwazilandSyrian Arab RepublicTajikistanTanzaniaThailandTimor-LesteTogoTongaTrinidad and TobagoTunisiaTurkeyTuvaluUgandaUkraineUpper middle incomeUruguayVanuatuVenezuela, RBVietnamWest Bank and GazaWorldYemen, Rep.ZambiaZimbabwe La ligne de temps
Cette échelle de temps montre un graphique de 1972 année à 2015 année Haiti. Les données jusqu'à 1971 année ne sont pas présentés. Quantité d'observations actuelles selon dates: 44.
Source (désignation):
Les indicateurs du développement mondiale
Source (organisation):
Development Assistance Committee of the Organisation for Economic Co-operation and Development, Geographical Distribution of Financial Flows to Developing Countries, Development Co-operation Report, and International Development Statistics database. Data are available online at: www.oecd.org/dac/stats/idsonline. World Bank imports of good and services estimates are used for the denominator.
Catégories:
Aid Effectiveness
Dernière mise à jour
23 avr. 2017
Les indicateurs de changement de valeurs selon les années
Minimum:
7.727
1 janv. 1972
Maximum:
243.264
1 janv. 1995
Pour la date d''observation
Valeur
Changement absolu
Le changement par rapport à la valeur précédente
1 janv. 1972
7.727
+7.727
0.0%
1 janv. 1973
7.895
+0.168
2.17%
1 janv. 1974
7.747
-0.149
-1.88%
1 janv. 1975
9.846
+2.099
27.1%
1 janv. 1976
33.657
+23.811
241.84%
1 janv. 1977
32.02
-1.637
-4.86%
1 janv. 1978
31.147
-0.873
-2.73%
1 janv. 1979
27.956
-3.191
-10.25%
1 janv. 1980
26.396
-1.56
-5.58%
1 janv. 1981
20.852
-5.543
-21.0%
1 janv. 1982
19.882
-0.97
-4.65%
1 janv. 1983
25.801
+5.919
29.77%
1 janv. 1984
25.554
-0.247
-0.96%
1 janv. 1985
24.016
-1.539
-6.02%
1 janv. 1986
25.571
+1.556
6.48%
1 janv. 1987
36.611
+11.04
43.17%
1 janv. 1988
40.339
+3.728
10.18%
1 janv. 1989
27.555
-12.784
-31.69%
1 janv. 1990
40.971
+13.415
48.68%
1 janv. 1991
31.015
-9.955
-24.3%
1 janv. 1992
32.124
+1.108
3.57%
1 janv. 1993
38.743
+6.62
20.61%
1 janv. 1994
39.779
+1.036
2.67%
1 janv. 1995
243.264
+203.485
511.54%
1 janv. 1996
86.774
-156.49
-64.33%
1 janv. 1997
46.387
-40.387
-46.54%
1 janv. 1998
35.92
-10.467
-22.56%
1 janv. 1999
38.702
+2.781
7.74%
1 janv. 2000
20.779
-17.922
-46.31%
1 janv. 2001
15.082
-5.698
-27.42%
1 janv. 2002
12.852
-2.23
-14.79%
1 janv. 2003
12.326
-0.525
-4.09%
1 janv. 2004
14.866
+2.539
20.6%
1 janv. 2005
18.971
+4.105
27.61%
1 janv. 2006
22.543
+3.572
18.83%
1 janv. 2007
26.979
+4.436
19.68%
1 janv. 2008
29.184
+2.205
8.17%
1 janv. 2009
31.71
+2.526
8.66%
1 janv. 2010
39.668
+7.958
25.1%
1 janv. 2011
70.642
+30.974
78.08%
1 janv. 2012
38.088
-32.554
-46.08%
1 janv. 2013
30.282
-7.806
-20.49%
1 janv. 2014
25.978
-4.304
-14.21%
1 janv. 2015
22.682
-3.296
-12.69%
Classement des pays selon les statistiques actuelles par années


Commentaires: