29
/fr/
fr
AIzaSyAYiBZKx7MnpbEhh9jyipgxe19OcubqV5w
April 1, 2024
100304
Cameroon
CMR
true
2
1
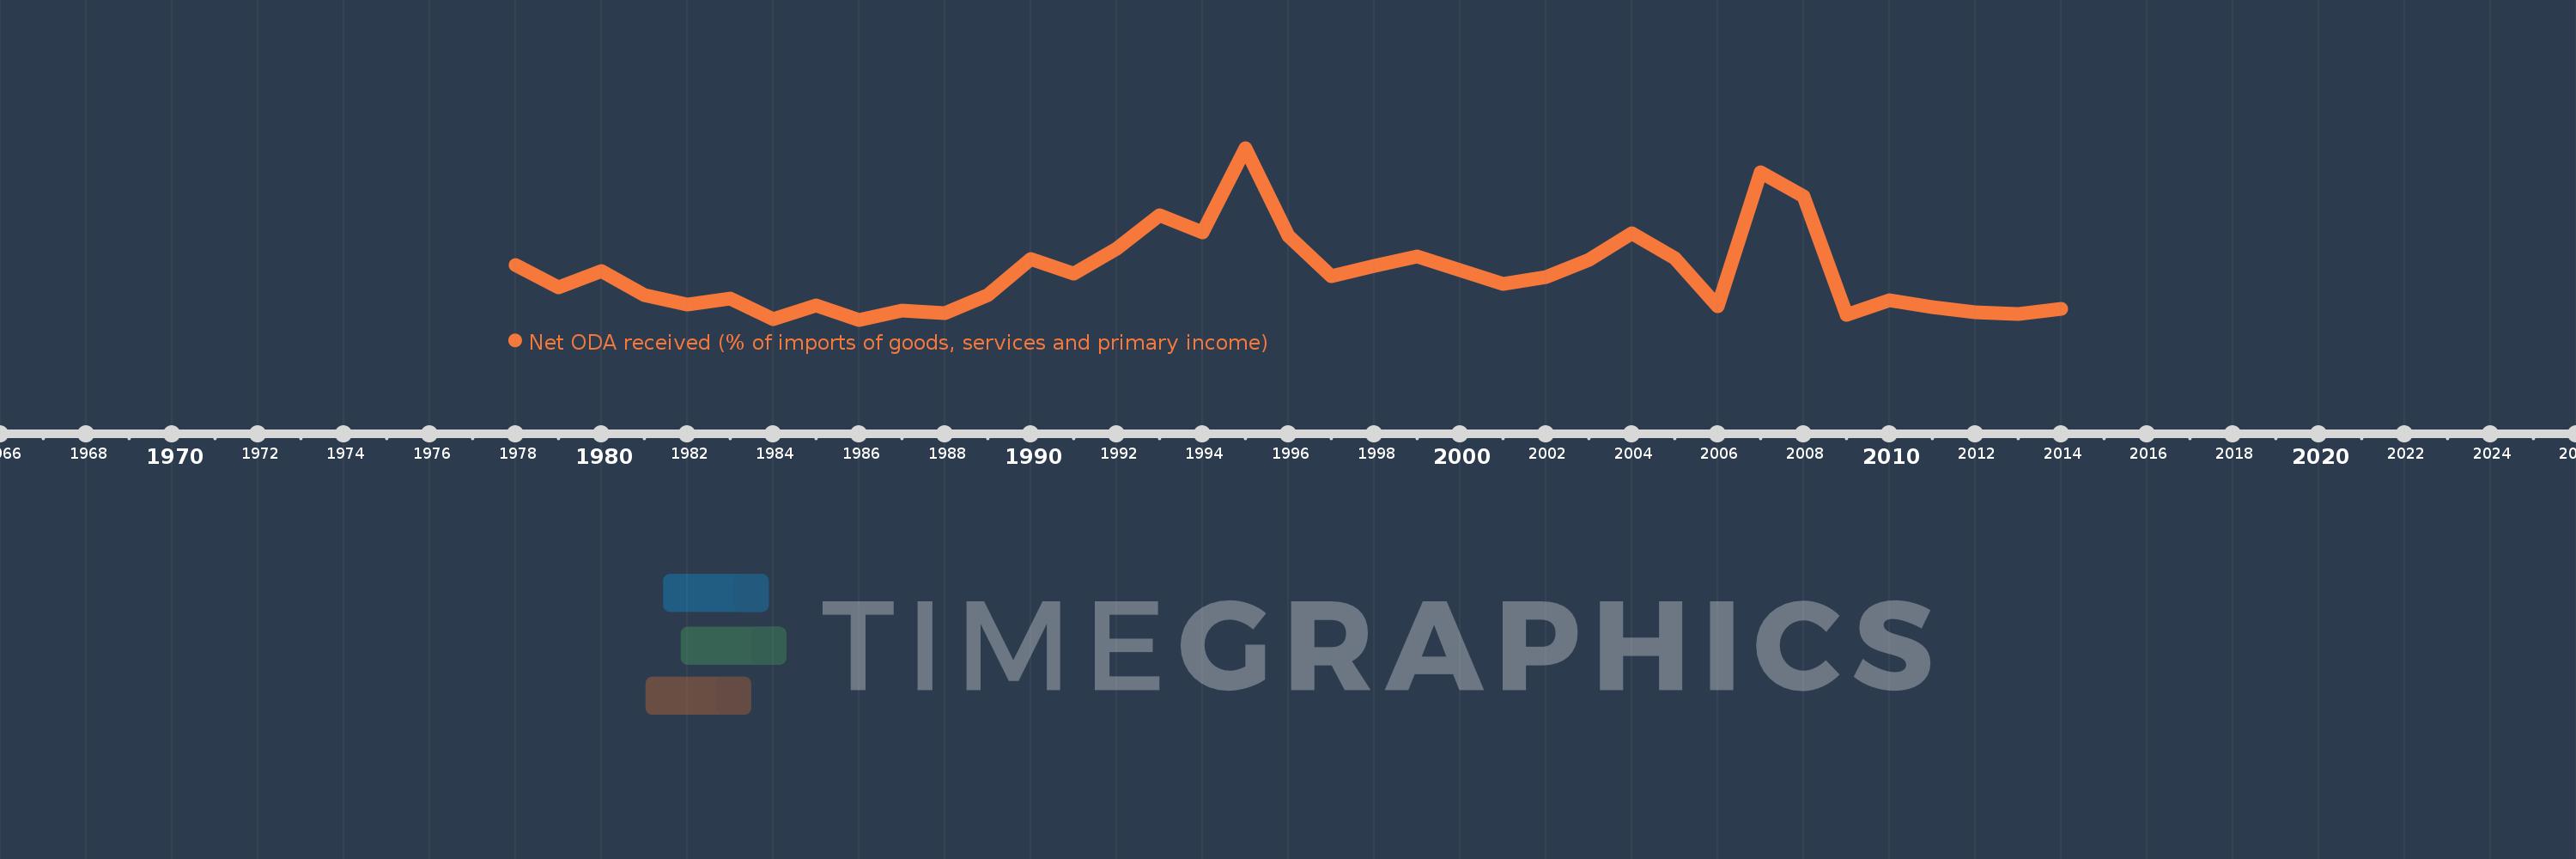
Net ODA received (% of imports of goods, services and primary income)
2014,2013,2012,2011,2010,2009,2008,2007,2006,2005,2004,2003,2002,2001,2000,1999,1998,1997,1996,1995,1994,1993,1992,1991,1990,1989,1988,1987,1986,1985,1984,1983,1982,1981,1980,1979,1978
Cette statistique dans les autres pays:
AfghanistanAlbaniaAlgeriaAngolaAntigua and BarbudaArab WorldArgentinaArmeniaArubaAzerbaijanBahamas, TheBahrainBangladeshBarbadosBelarusBelizeBeninBhutanBoliviaBosnia and HerzegovinaBotswanaBrazilBurkina FasoBurundiCabo VerdeCambodiaCameroonCaribbean small statesCentral African RepublicCentral Europe and the BalticsChadChileChinaColombiaComorosCongo, Dem. Rep.Congo, Rep.Costa RicaCote d'IvoireCroatiaCyprusDjiboutiDominicaDominican RepublicEast Asia & PacificEast Asia & Pacific (excluding high income)East Asia & Pacific (IDA & IBRD countries)EcuadorEgypt, Arab Rep.El SalvadorEquatorial GuineaEritreaEthiopiaEuro areaEurope & Central AsiaEurope & Central Asia (excluding high income)Europe & Central Asia (IDA & IBRD countries)European UnionFijiFragile and conflict affected situationsGabonGambia, TheGeorgiaGhanaGrenadaGuatemalaGuineaGuinea-BissauGuyanaHaitiHeavily indebted poor countries (HIPC)High incomeHondurasIBRD onlyIDA & IBRD totalIDA blendIDA onlyIDA totalIndiaIndonesiaIran, Islamic Rep.IraqIsraelJamaicaJordanKazakhstanKenyaKiribatiKorea, Rep.KosovoKuwaitKyrgyz RepublicLao PDRLatin America & Caribbean Latin America & Caribbean (excluding high income)Latin America & the Caribbean (IDA & IBRD countries)Least developed countries: UN classificationLebanonLesothoLiberiaLibyaLow & middle incomeLow incomeLower middle incomeMacedonia, FYRMadagascarMalawiMalaysiaMaldivesMaliMaltaMarshall IslandsMauritaniaMauritiusMexicoMicronesia, Fed. Sts.Middle East & North Africa (excluding high income)Middle East & North Africa (IDA & IBRD countries)Middle incomeMoldovaMongoliaMontenegroMoroccoMozambiqueMyanmarNamibiaNepalNicaraguaNigerNigeriaNorth AmericaOECD membersOmanOther small statesPacific island small statesPakistanPalauPanamaPapua New GuineaParaguayPeruPhilippinesRwandaSamoaSao Tome and PrincipeSaudi ArabiaSenegalSerbiaSeychellesSierra LeoneSingaporeSloveniaSmall statesSolomon IslandsSouth AfricaSouth AsiaSouth Asia (IDA & IBRD)South SudanSri LankaSt. Kitts and NevisSt. LuciaSt. Vincent and the GrenadinesSub-Saharan Africa Sub-Saharan Africa (excluding high income)Sub-Saharan Africa (IDA & IBRD countries)SudanSurinameSwazilandSyrian Arab RepublicTajikistanTanzaniaThailandTimor-LesteTogoTongaTrinidad and TobagoTunisiaTurkeyTuvaluUgandaUkraineUpper middle incomeUruguayVanuatuVenezuela, RBVietnamWest Bank and GazaWorldYemen, Rep.ZambiaZimbabwe La ligne de temps
Cette échelle de temps montre un graphique de 1978 année à 2014 année Cameroon. Les données jusqu'à 1977 année ne sont pas présentés. Quantité d'observations actuelles selon dates: 37.
Source (désignation):
Les indicateurs du développement mondiale
Source (organisation):
Development Assistance Committee of the Organisation for Economic Co-operation and Development, Geographical Distribution of Financial Flows to Developing Countries, Development Co-operation Report, and International Development Statistics database. Data are available online at: www.oecd.org/dac/stats/idsonline. World Bank imports of good and services estimates are used for the denominator.
Catégories:
Aid Effectiveness
Dernière mise à jour
23 avr. 2017
Les indicateurs de changement de valeurs selon les années
Minimum:
5.635
1 janv. 1986
Maximum:
38.797
1 janv. 1995
Pour la date d''observation
Valeur
Changement absolu
Le changement par rapport à la valeur précédente
1 janv. 1978
16.259
+16.259
0.0%
1 janv. 1979
11.927
-4.332
-26.65%
1 janv. 1980
15.014
+3.087
25.88%
1 janv. 1981
10.376
-4.638
-30.89%
1 janv. 1982
8.601
-1.776
-17.11%
1 janv. 1983
9.73
+1.129
13.13%
1 janv. 1984
5.674
-4.056
-41.68%
1 janv. 1985
8.38
+2.706
47.69%
1 janv. 1986
5.635
-2.745
-32.76%
1 janv. 1987
7.381
+1.746
30.99%
1 janv. 1988
6.989
-0.392
-5.31%
1 janv. 1989
10.468
+3.479
49.77%
1 janv. 1990
17.409
+6.941
66.31%
1 janv. 1991
14.612
-2.798
-16.07%
1 janv. 1992
19.32
+4.708
32.22%
1 janv. 1993
25.78
+6.46
33.44%
1 janv. 1994
22.505
-3.274
-12.7%
1 janv. 1995
38.797
+16.292
72.39%
1 janv. 1996
21.788
-17.009
-43.84%
1 janv. 1997
14.066
-7.722
-35.44%
1 janv. 1998
15.955
+1.889
13.43%
1 janv. 1999
17.901
+1.946
12.2%
1 janv. 2000
15.214
-2.687
-15.01%
1 janv. 2001
12.475
-2.739
-18.0%
1 janv. 2002
13.854
+1.379
11.05%
1 janv. 2003
17.228
+3.373
24.35%
1 janv. 2004
22.403
+5.175
30.04%
1 janv. 2005
17.519
-4.884
-21.8%
1 janv. 2006
8.259
-9.26
-52.86%
1 janv. 2007
34.167
+25.908
313.7%
1 janv. 2008
29.402
-4.765
-13.95%
1 janv. 2009
6.501
-22.901
-77.89%
1 janv. 2010
9.476
+2.975
45.76%
1 janv. 2011
8.07
-1.406
-14.84%
1 janv. 2012
7.043
-1.026
-12.72%
1 janv. 2013
6.767
-0.276
-3.93%
1 janv. 2014
7.743
+0.976
14.43%
Classement des pays selon les statistiques actuelles par années


Commentaires: