29
/fr/
fr
AIzaSyAYiBZKx7MnpbEhh9jyipgxe19OcubqV5w
April 1, 2024
54439
Pacific island small states
PSS
false
2
1
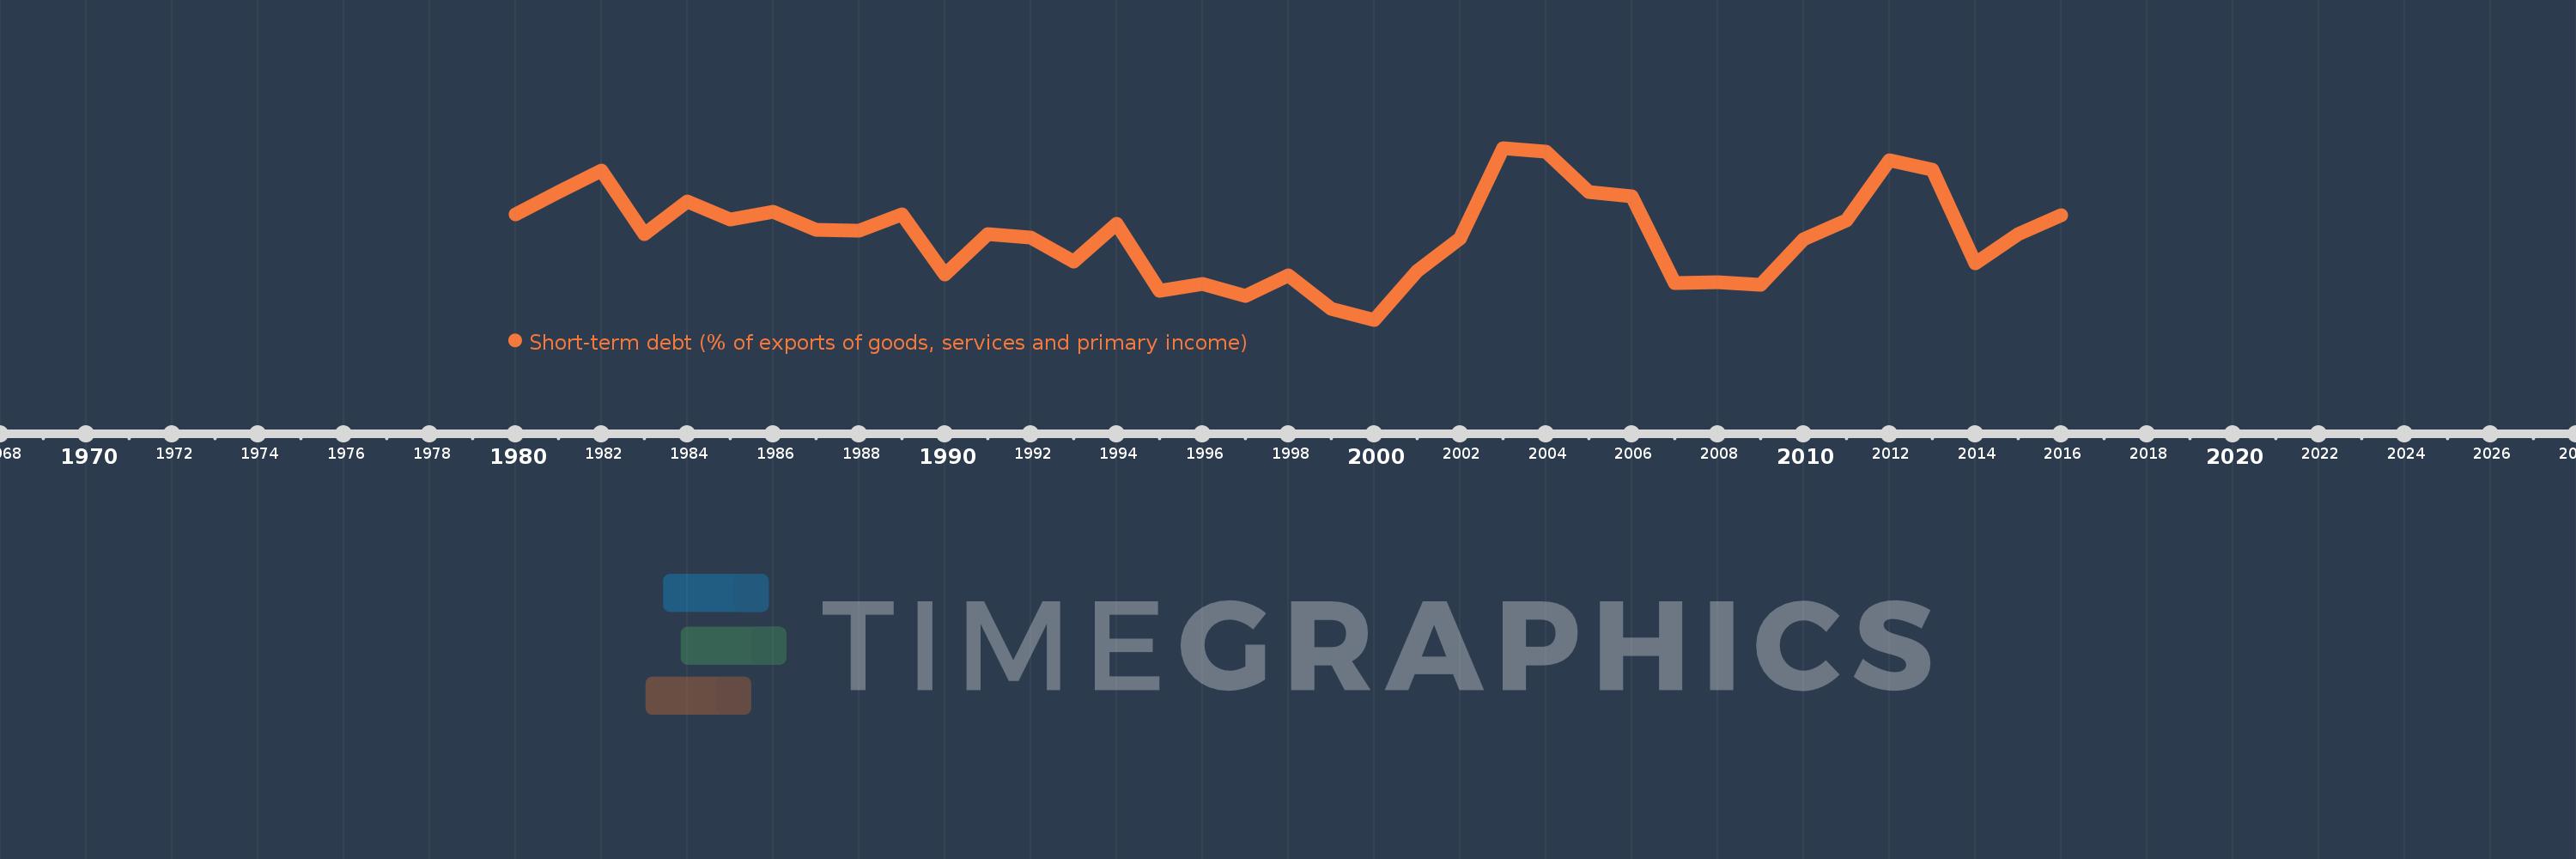
Short-term debt (% of exports of goods, services and primary income)
2016,2015,2014,2013,2012,2011,2010,2009,2008,2007,2006,2005,2004,2003,2002,2001,2000,1999,1998,1997,1996,1995,1994,1993,1992,1991,1990,1989,1988,1987,1986,1985,1984,1983,1982,1981,1980
Cette statistique dans les autres pays:
La ligne de temps
Cette échelle de temps montre un graphique de 1980 année à 2016 année Pacific island small states. Les données jusqu'à 1979 année ne sont pas présentés. Quantité d'observations actuelles selon dates: 37.
Source (désignation):
Les indicateurs du développement mondiale
Source (organisation):
World Bank, International Debt Statistics.
Catégories:
Economy & Growth, External Debt
Dernière mise à jour
23 avr. 2017
Les indicateurs de changement de valeurs selon les années
Minimum:
0.384
1 janv. 2000
Maximum:
7.713
1 janv. 2003
Pour la date d''observation
Valeur
Changement absolu
Le changement par rapport à la valeur précédente
1 janv. 1980
4.883
+4.883
0.0%
1 janv. 1981
5.828
+0.946
19.37%
1 janv. 1982
6.754
+0.925
15.88%
1 janv. 1983
4.049
-2.705
-40.05%
1 janv. 1984
5.448
+1.398
34.54%
1 janv. 1985
4.653
-0.795
-14.59%
1 janv. 1986
5.008
+0.355
7.63%
1 janv. 1987
4.213
-0.795
-15.88%
1 janv. 1988
4.177
-0.036
-0.85%
1 janv. 1989
4.87
+0.693
16.59%
1 janv. 1990
2.312
-2.557
-52.52%
1 janv. 1991
4.024
+1.711
73.99%
1 janv. 1992
3.881
-0.142
-3.53%
1 janv. 1993
2.881
-1.0
-25.77%
1 janv. 1994
4.481
+1.6
55.54%
1 janv. 1995
1.615
-2.867
-63.97%
1 janv. 1996
1.924
+0.309
19.16%
1 janv. 1997
1.4
-0.524
-27.22%
1 janv. 1998
2.29
+0.89
63.58%
1 janv. 1999
0.836
-1.454
-63.49%
1 janv. 2000
0.384
-0.452
-54.04%
1 janv. 2001
2.445
+2.06
536.04%
1 janv. 2002
3.87
+1.425
58.3%
1 janv. 2003
7.713
+3.843
99.31%
1 janv. 2004
7.573
-0.14
-1.81%
1 janv. 2005
5.851
-1.722
-22.74%
1 janv. 2006
5.668
-0.183
-3.13%
1 janv. 2007
1.949
-3.719
-65.61%
1 janv. 2008
1.992
+0.043
2.19%
1 janv. 2009
1.859
-0.133
-6.7%
1 janv. 2010
3.834
+1.976
106.31%
1 janv. 2011
4.627
+0.793
20.68%
1 janv. 2012
7.198
+2.571
55.57%
1 janv. 2013
6.798
-0.4
-5.55%
1 janv. 2014
2.796
-4.002
-58.87%
1 janv. 2015
4.035
+1.239
44.3%
1 janv. 2016
4.856
+0.821
20.35%
Classement des pays selon les statistiques actuelles par années


Commentaires: