29
/fr/
fr
AIzaSyAYiBZKx7MnpbEhh9jyipgxe19OcubqV5w
April 1, 2024
202307
Morocco
MAR
true
2
1
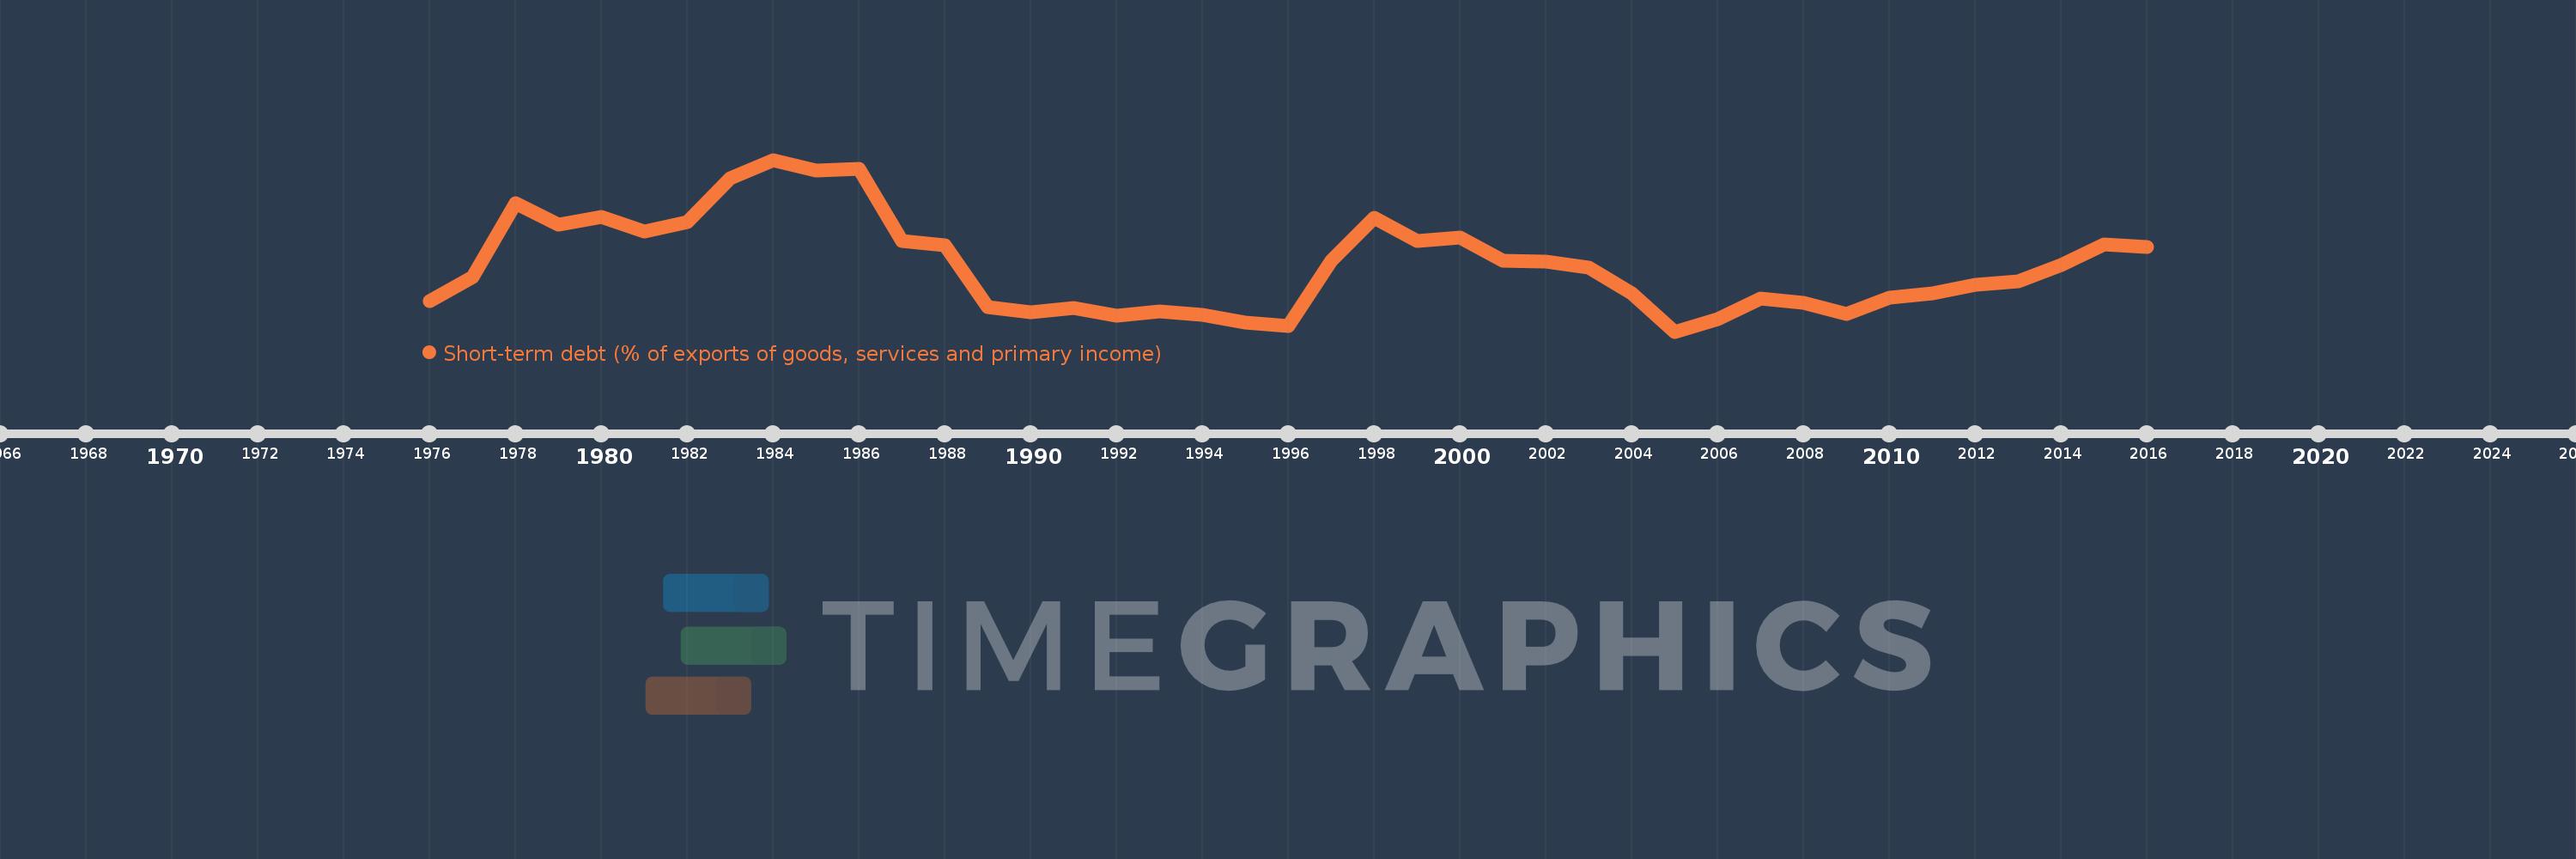
Short-term debt (% of exports of goods, services and primary income)
2016,2015,2014,2013,2012,2011,2010,2009,2008,2007,2006,2005,2004,2003,2002,2001,2000,1999,1998,1997,1996,1995,1994,1993,1992,1991,1990,1989,1988,1987,1986,1985,1984,1983,1982,1981,1980,1979,1978,1977,1976
Cette statistique dans les autres pays:
La ligne de temps
Cette échelle de temps montre un graphique de 1976 année à 2016 année Morocco. Les données jusqu'à 1975 année ne sont pas présentés. Quantité d'observations actuelles selon dates: 41.
Source (désignation):
Les indicateurs du développement mondiale
Source (organisation):
World Bank, International Debt Statistics.
Catégories:
Economy & Growth, External Debt
Dernière mise à jour
23 avr. 2017
Les indicateurs de changement de valeurs selon les années
Minimum:
1.192
1 janv. 2005
Maximum:
40.03
1 janv. 1984
Pour la date d''observation
Valeur
Changement absolu
Le changement par rapport à la valeur précédente
1 janv. 1976
7.996
+7.996
0.0%
1 janv. 1977
13.487
+5.491
68.68%
1 janv. 1978
30.2
+16.713
123.92%
1 janv. 1979
25.365
-4.835
-16.01%
1 janv. 1980
27.109
+1.744
6.88%
1 janv. 1981
23.773
-3.336
-12.3%
1 janv. 1982
25.977
+2.204
9.27%
1 janv. 1983
35.937
+9.96
38.34%
1 janv. 1984
40.03
+4.093
11.39%
1 janv. 1985
37.619
-2.411
-6.02%
1 janv. 1986
38.05
+0.431
1.15%
1 janv. 1987
21.609
-16.441
-43.21%
1 janv. 1988
20.669
-0.939
-4.35%
1 janv. 1989
6.808
-13.861
-67.06%
1 janv. 1990
5.559
-1.25
-18.35%
1 janv. 1991
6.445
+0.886
15.95%
1 janv. 1992
4.728
-1.717
-26.65%
1 janv. 1993
5.814
+1.086
22.97%
1 janv. 1994
5.008
-0.806
-13.86%
1 janv. 1995
3.328
-1.68
-33.55%
1 janv. 1996
2.533
-0.795
-23.89%
1 janv. 1997
17.121
+14.588
575.93%
1 janv. 1998
26.89
+9.769
57.06%
1 janv. 1999
21.74
-5.151
-19.15%
1 janv. 2000
22.509
+0.769
3.54%
1 janv. 2001
17.235
-5.274
-23.43%
1 janv. 2002
17.086
-0.149
-0.87%
1 janv. 2003
15.622
-1.464
-8.57%
1 janv. 2004
9.863
-5.759
-36.87%
1 janv. 2005
1.192
-8.671
-87.92%
1 janv. 2006
3.947
+2.755
231.22%
1 janv. 2007
8.589
+4.642
117.63%
1 janv. 2008
7.704
-0.885
-10.31%
1 janv. 2009
5.159
-2.544
-33.03%
1 janv. 2010
8.868
+3.709
71.89%
1 janv. 2011
9.842
+0.973
10.97%
1 janv. 2012
11.752
+1.91
19.41%
1 janv. 2013
12.646
+0.894
7.61%
1 janv. 2014
16.173
+3.527
27.89%
1 janv. 2015
20.89
+4.717
29.17%
1 janv. 2016
20.309
-0.58
-2.78%
Classement des pays selon les statistiques actuelles par années


Commentaires: