29
/fr/
fr
AIzaSyAYiBZKx7MnpbEhh9jyipgxe19OcubqV5w
April 1, 2024
34627
Fragile and conflict affected situations
FCS
false
2
1
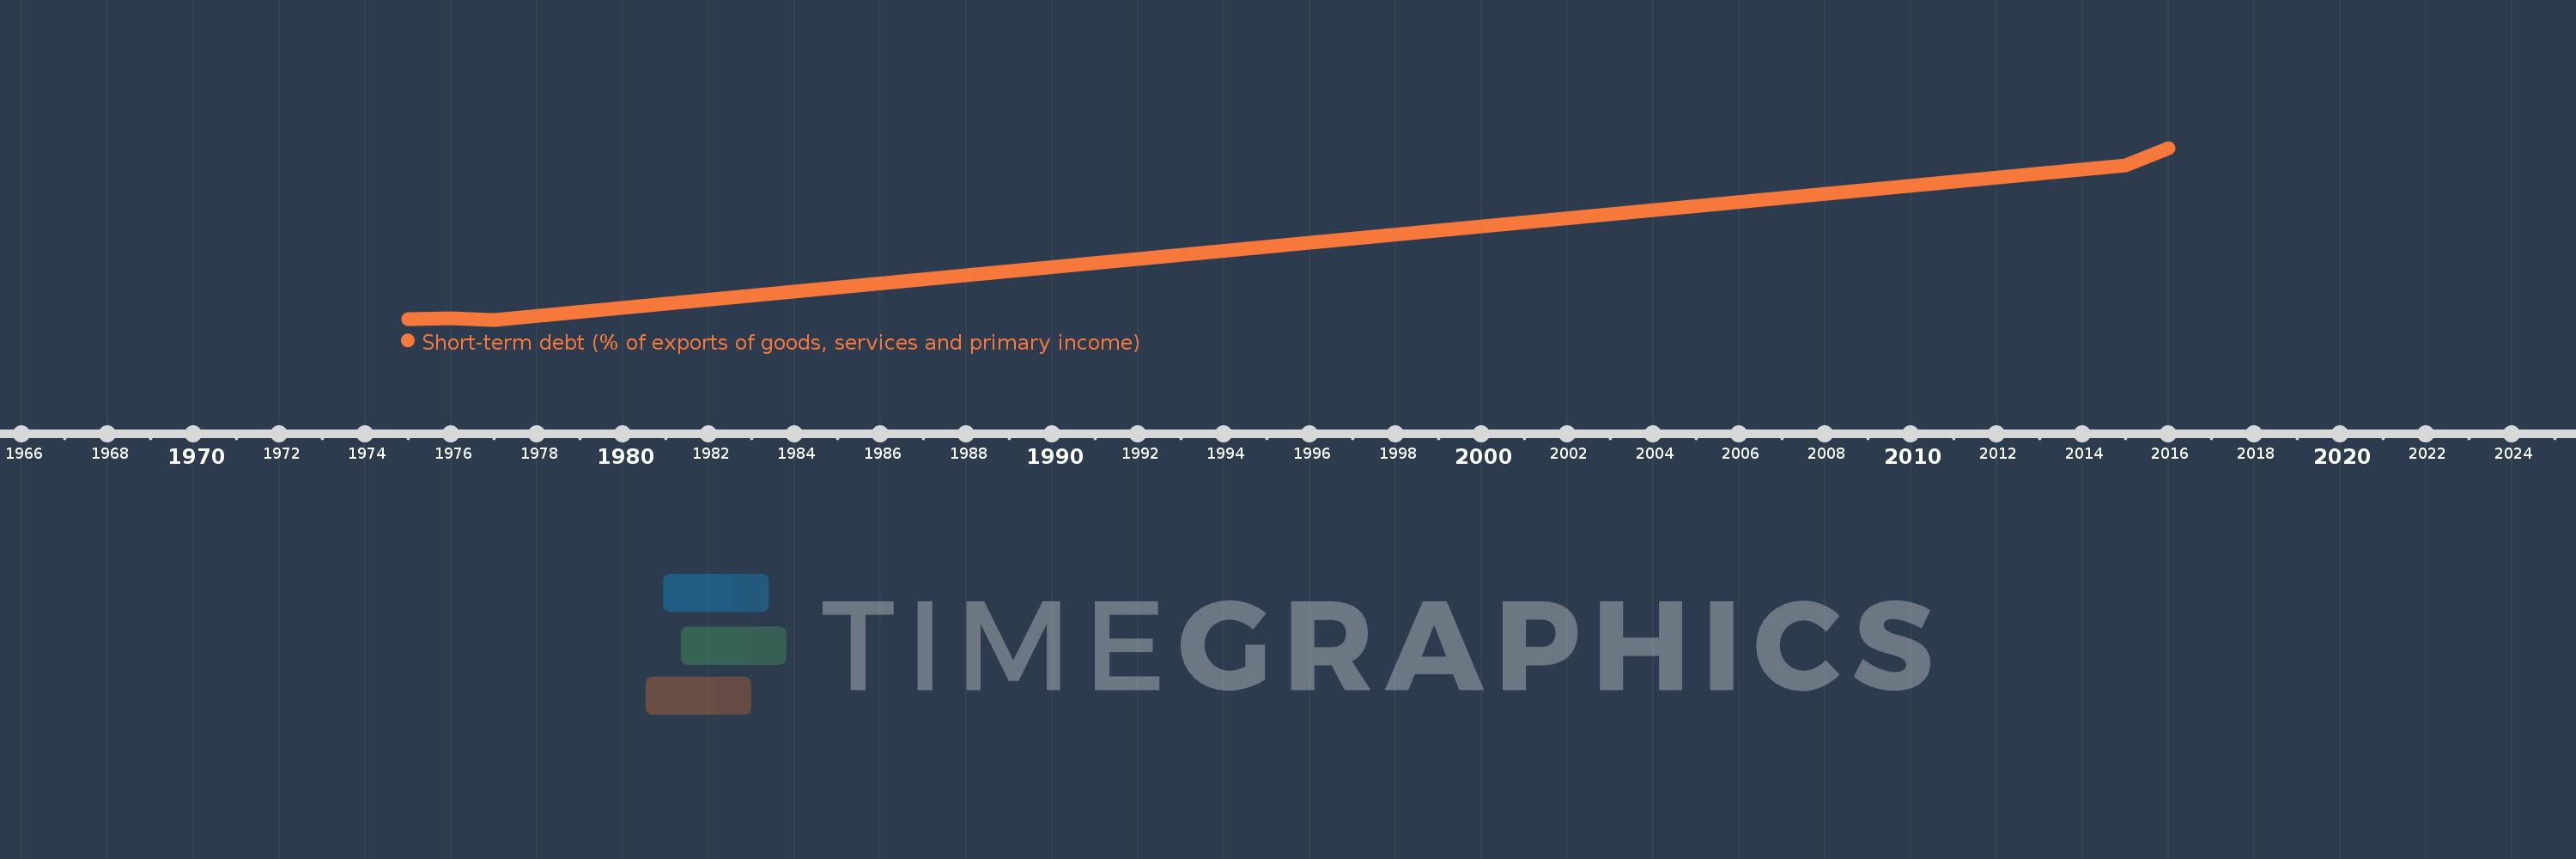
Short-term debt (% of exports of goods, services and primary income)
2016,2015,1977,1976,1975
Cette statistique dans les autres pays:
La ligne de temps
Cette échelle de temps montre un graphique de 1975 année à 2016 année Fragile and conflict affected situations. Les données jusqu'à 1974 année ne sont pas présentés. Quantité d'observations actuelles selon dates: 5.
Source (désignation):
Les indicateurs du développement mondiale
Source (organisation):
World Bank, International Debt Statistics.
Catégories:
Economy & Growth, External Debt
Dernière mise à jour
23 avr. 2017
Les indicateurs de changement de valeurs selon les années
Minimum:
0.041
1 janv. 1977
Maximum:
19.18
1 janv. 2016
Pour la date d''observation
Valeur
Changement absolu
Le changement par rapport à la valeur précédente
1 janv. 1975
0.074
+0.074
0.0%
1 janv. 1976
0.187
+0.112
150.8%
1 janv. 1977
0.041
-0.146
-78.0%
1 janv. 2015
17.274
+17.233
41.94 milles%
1 janv. 2016
19.18
+1.906
11.03%
Classement des pays selon les statistiques actuelles par années


Commentaires: