29
/fr/
fr
AIzaSyAYiBZKx7MnpbEhh9jyipgxe19OcubqV5w
April 1, 2024
33070
Europe & Central Asia (IDA & IBRD countries)
TEC
false
2
1
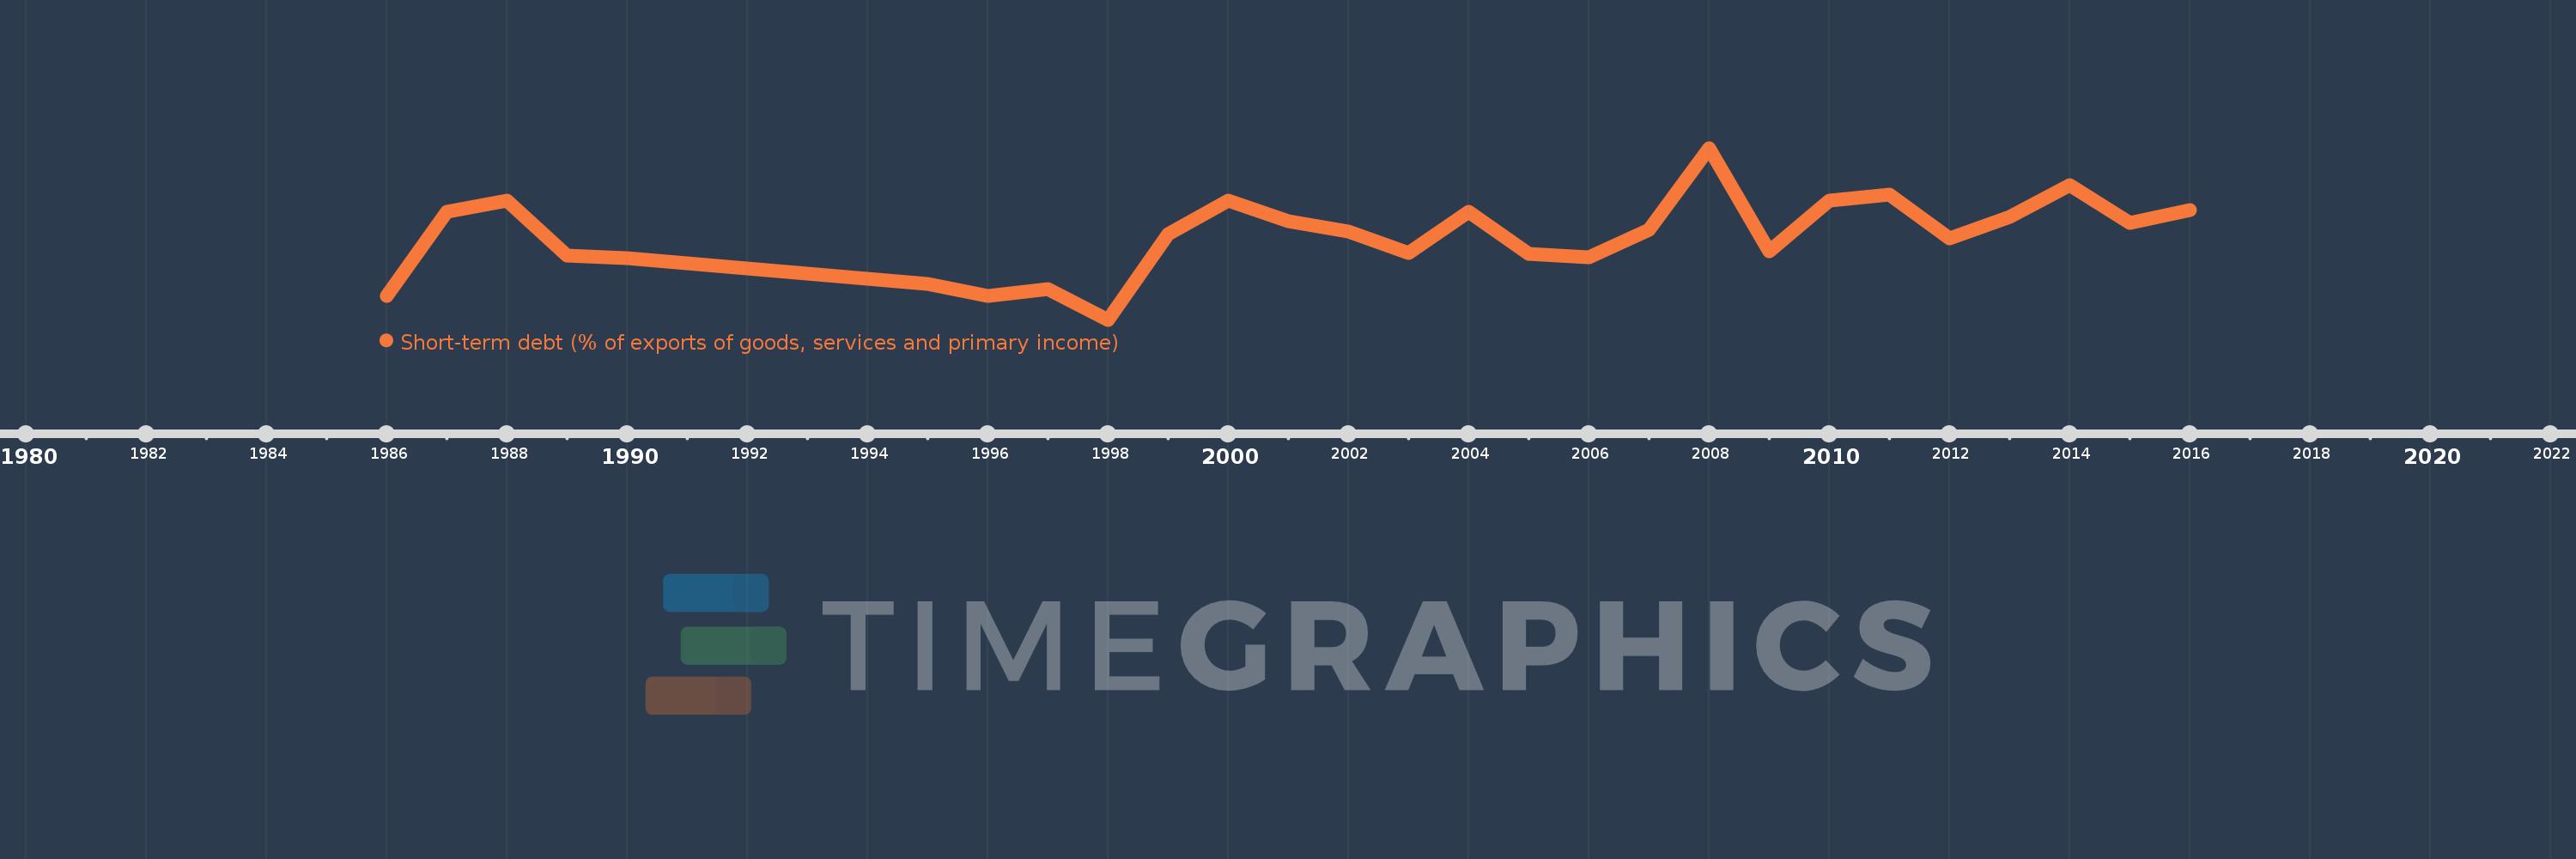
Short-term debt (% of exports of goods, services and primary income)
2016,2015,2014,2013,2012,2011,2010,2009,2008,2007,2006,2005,2004,2003,2002,2001,2000,1999,1998,1997,1996,1995,1990,1989,1988,1987,1986
Cette statistique dans les autres pays:
La ligne de temps
Cette échelle de temps montre un graphique de 1986 année à 2016 année Europe & Central Asia (IDA & IBRD countries). Les données jusqu'à 1985 année ne sont pas présentés. Quantité d'observations actuelles selon dates: 27.
Source (désignation):
Les indicateurs du développement mondiale
Source (organisation):
World Bank, International Debt Statistics.
Catégories:
Economy & Growth, External Debt
Dernière mise à jour
23 avr. 2017
Les indicateurs de changement de valeurs selon les années
Minimum:
13.902
1 janv. 1998
Maximum:
27.375
1 janv. 2008
Pour la date d''observation
Valeur
Changement absolu
Le changement par rapport à la valeur précédente
1 janv. 1986
15.754
+15.754
0.0%
1 janv. 1987
22.345
+6.592
41.84%
1 janv. 1988
23.219
+0.874
3.91%
1 janv. 1989
18.929
-4.29
-18.48%
1 janv. 1990
18.718
-0.211
-1.11%
1 janv. 1995
16.682
-2.036
-10.88%
1 janv. 1996
15.742
-0.94
-5.63%
1 janv. 1997
16.275
+0.533
3.38%
1 janv. 1998
13.902
-2.373
-14.58%
1 janv. 1999
20.634
+6.732
48.42%
1 janv. 2000
23.278
+2.643
12.81%
1 janv. 2001
21.596
-1.682
-7.23%
1 janv. 2002
20.808
-0.787
-3.65%
1 janv. 2003
19.153
-1.656
-7.96%
1 janv. 2004
22.365
+3.212
16.77%
1 janv. 2005
19.07
-3.295
-14.73%
1 janv. 2006
18.794
-0.276
-1.45%
1 janv. 2007
20.978
+2.184
11.62%
1 janv. 2008
27.375
+6.397
30.49%
1 janv. 2009
19.249
-8.126
-29.68%
1 janv. 2010
23.267
+4.018
20.87%
1 janv. 2011
23.733
+0.466
2.0%
1 janv. 2012
20.293
-3.44
-14.5%
1 janv. 2013
21.96
+1.667
8.22%
1 janv. 2014
24.442
+2.481
11.3%
1 janv. 2015
21.502
-2.94
-12.03%
1 janv. 2016
22.528
+1.026
4.77%
Classement des pays selon les statistiques actuelles par années


Commentaires: