29
/fr/
fr
AIzaSyAYiBZKx7MnpbEhh9jyipgxe19OcubqV5w
April 1, 2024
106656
China
CHN
true
2
1
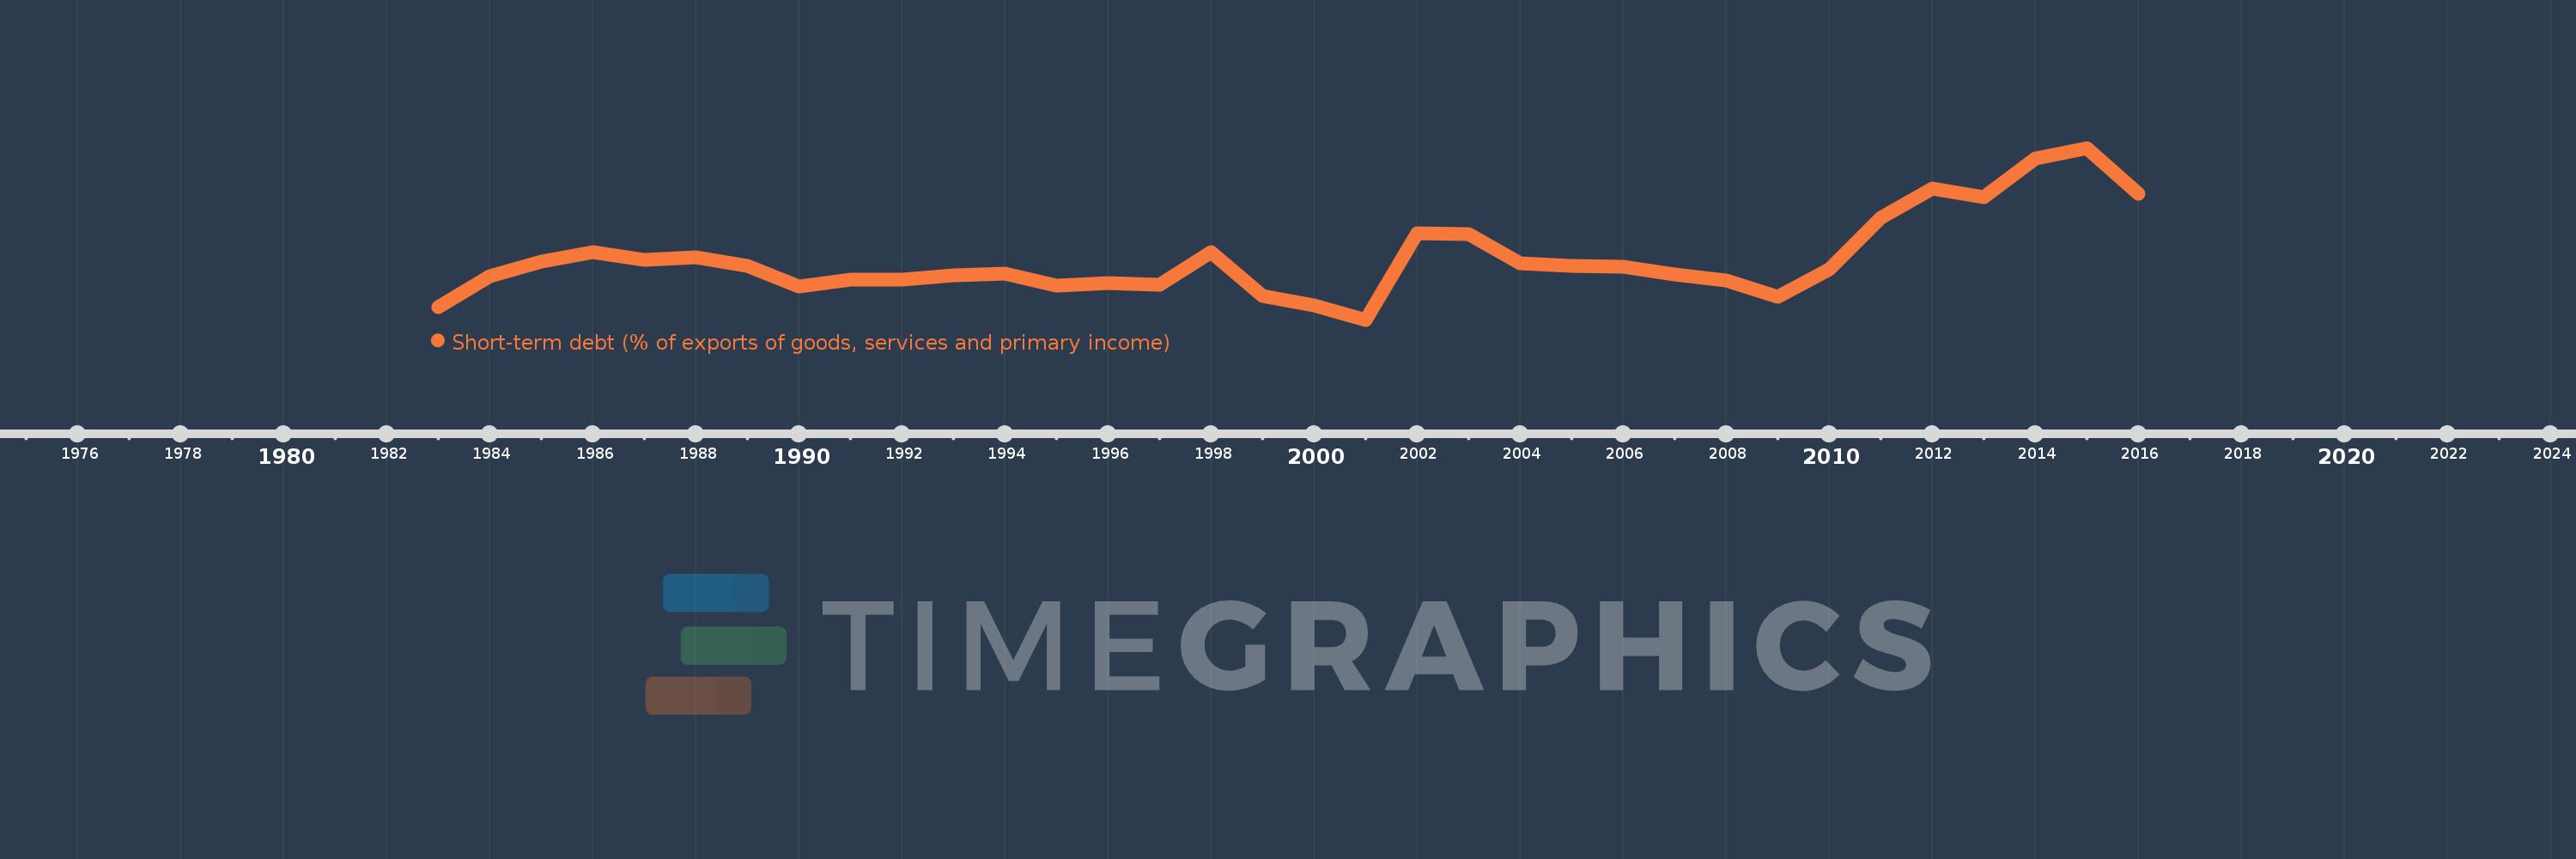
Short-term debt (% of exports of goods, services and primary income)
2016,2015,2014,2013,2012,2011,2010,2009,2008,2007,2006,2005,2004,2003,2002,2001,2000,1999,1998,1997,1996,1995,1994,1993,1992,1991,1990,1989,1988,1987,1986,1985,1984,1983
Cette statistique dans les autres pays:
La ligne de temps
Cette échelle de temps montre un graphique de 1983 année à 2016 année China. Les données jusqu'à 1982 année ne sont pas présentés. Quantité d'observations actuelles selon dates: 34.
Source (désignation):
Les indicateurs du développement mondiale
Source (organisation):
World Bank, International Debt Statistics.
Catégories:
Economy & Growth, External Debt
Dernière mise à jour
23 avr. 2017
Les indicateurs de changement de valeurs selon les années
Minimum:
6.456
1 janv. 2001
Maximum:
44.849
1 janv. 2015
Pour la date d''observation
Valeur
Changement absolu
Le changement par rapport à la valeur précédente
1 janv. 1983
9.301
+9.301
0.0%
1 janv. 1984
16.107
+6.806
73.18%
1 janv. 1985
19.496
+3.389
21.04%
1 janv. 1986
21.656
+2.16
11.08%
1 janv. 1987
19.802
-1.853
-8.56%
1 janv. 1988
20.477
+0.675
3.41%
1 janv. 1989
18.586
-1.892
-9.24%
1 janv. 1990
13.893
-4.693
-25.25%
1 janv. 1991
15.428
+1.535
11.05%
1 janv. 1992
15.485
+0.057
0.37%
1 janv. 1993
16.307
+0.822
5.31%
1 janv. 1994
16.764
+0.457
2.8%
1 janv. 1995
13.996
-2.769
-16.52%
1 janv. 1996
14.646
+0.651
4.65%
1 janv. 1997
14.194
-0.452
-3.09%
1 janv. 1998
21.515
+7.321
51.57%
1 janv. 1999
11.8
-9.715
-45.15%
1 janv. 2000
9.595
-2.205
-18.69%
1 janv. 2001
6.456
-3.138
-32.71%
1 janv. 2002
25.83
+19.374
300.07%
1 janv. 2003
25.659
-0.171
-0.66%
1 janv. 2004
19.065
-6.594
-25.7%
1 janv. 2005
18.513
-0.551
-2.89%
1 janv. 2006
18.246
-0.268
-1.45%
1 janv. 2007
16.571
-1.675
-9.18%
1 janv. 2008
15.195
-1.375
-8.3%
1 janv. 2009
11.648
-3.548
-23.35%
1 janv. 2010
17.711
+6.063
52.06%
1 janv. 2011
29.336
+11.626
65.64%
1 janv. 2012
35.825
+6.489
22.12%
1 janv. 2013
33.82
-2.005
-5.6%
1 janv. 2014
42.41
+8.59
25.4%
1 janv. 2015
44.849
+2.439
5.75%
1 janv. 2016
34.648
-10.201
-22.75%
Classement des pays selon les statistiques actuelles par années


Commentaires: