29
/fr/
fr
AIzaSyAYiBZKx7MnpbEhh9jyipgxe19OcubqV5w
April 1, 2024
286606
Zambia
ZMB
true
2
1
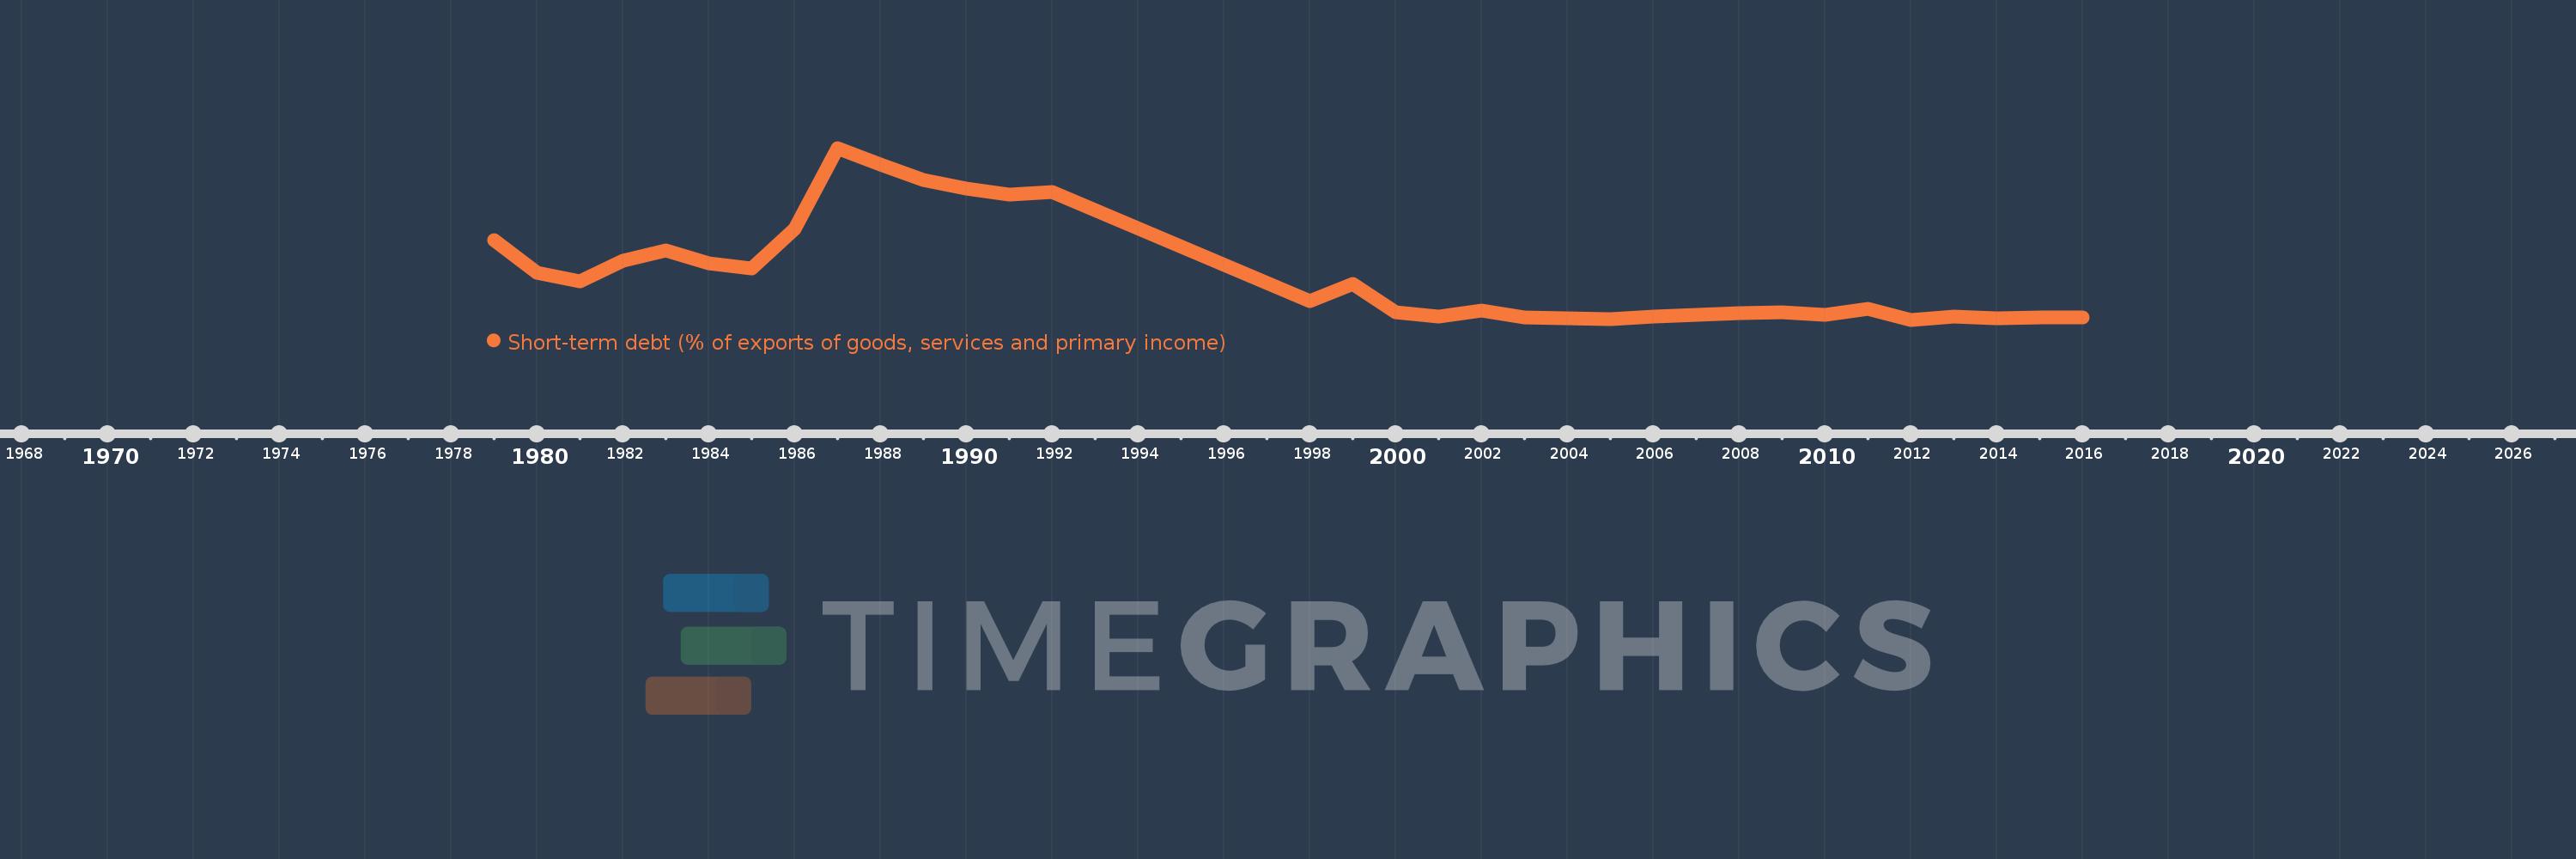
Short-term debt (% of exports of goods, services and primary income)
2016,2015,2014,2013,2012,2011,2010,2009,2008,2007,2006,2005,2004,2003,2002,2001,2000,1999,1998,1992,1991,1990,1989,1988,1987,1986,1985,1984,1983,1982,1981,1980,1979
Cette statistique dans les autres pays:
La ligne de temps
Cette échelle de temps montre un graphique de 1979 année à 2016 année Zambia. Les données jusqu'à 1978 année ne sont pas présentés. Quantité d'observations actuelles selon dates: 33.
Source (désignation):
Les indicateurs du développement mondiale
Source (organisation):
World Bank, International Debt Statistics.
Catégories:
Economy & Growth, External Debt
Dernière mise à jour
23 avr. 2017
Les indicateurs de changement de valeurs selon les années
Maximum:
140.351
1 janv. 1987
Pour la date d''observation
Valeur
Changement absolu
Le changement par rapport à la valeur précédente
1 janv. 1979
68.274
+68.274
0.0%
1 janv. 1980
42.467
-25.807
-37.8%
1 janv. 1981
36.081
-6.385
-15.04%
1 janv. 1982
52.225
+16.144
44.74%
1 janv. 1983
60.002
+7.777
14.89%
1 janv. 1984
49.765
-10.237
-17.06%
1 janv. 1985
45.77
-3.995
-8.03%
1 janv. 1986
77.219
+31.449
68.71%
1 janv. 1987
140.351
+63.132
81.76%
1 janv. 1988
127.351
-13.0
-9.26%
1 janv. 1989
115.014
-12.337
-9.69%
1 janv. 1990
108.643
-6.372
-5.54%
1 janv. 1991
103.765
-4.878
-4.49%
1 janv. 1992
106.045
+2.28
2.2%
1 janv. 1998
20.324
-85.721
-80.83%
1 janv. 1999
34.151
+13.826
68.03%
1 janv. 2000
11.899
-22.252
-65.16%
1 janv. 2001
8.556
-3.343
-28.09%
1 janv. 2002
13.104
+4.548
53.15%
1 janv. 2003
8.003
-5.1
-38.92%
1 janv. 2004
6.946
-1.058
-13.21%
1 janv. 2005
6.492
-0.454
-6.53%
1 janv. 2006
8.247
+1.755
27.03%
1 janv. 2007
9.702
+1.455
17.65%
1 janv. 2008
10.924
+1.222
12.59%
1 janv. 2009
11.9
+0.976
8.93%
1 janv. 2010
9.669
-2.231
-18.75%
1 janv. 2011
14.667
+4.998
51.69%
1 janv. 2012
5.95
-8.717
-59.43%
1 janv. 2013
8.166
+2.216
37.25%
1 janv. 2014
6.788
-1.378
-16.87%
1 janv. 2015
7.839
+1.051
15.48%
1 janv. 2016
7.529
-0.31
-3.95%
Classement des pays selon les statistiques actuelles par années


Commentaires: