29
/fr/
fr
AIzaSyAYiBZKx7MnpbEhh9jyipgxe19OcubqV5w
April 1, 2024
270178
Turkey
TUR
true
2
1
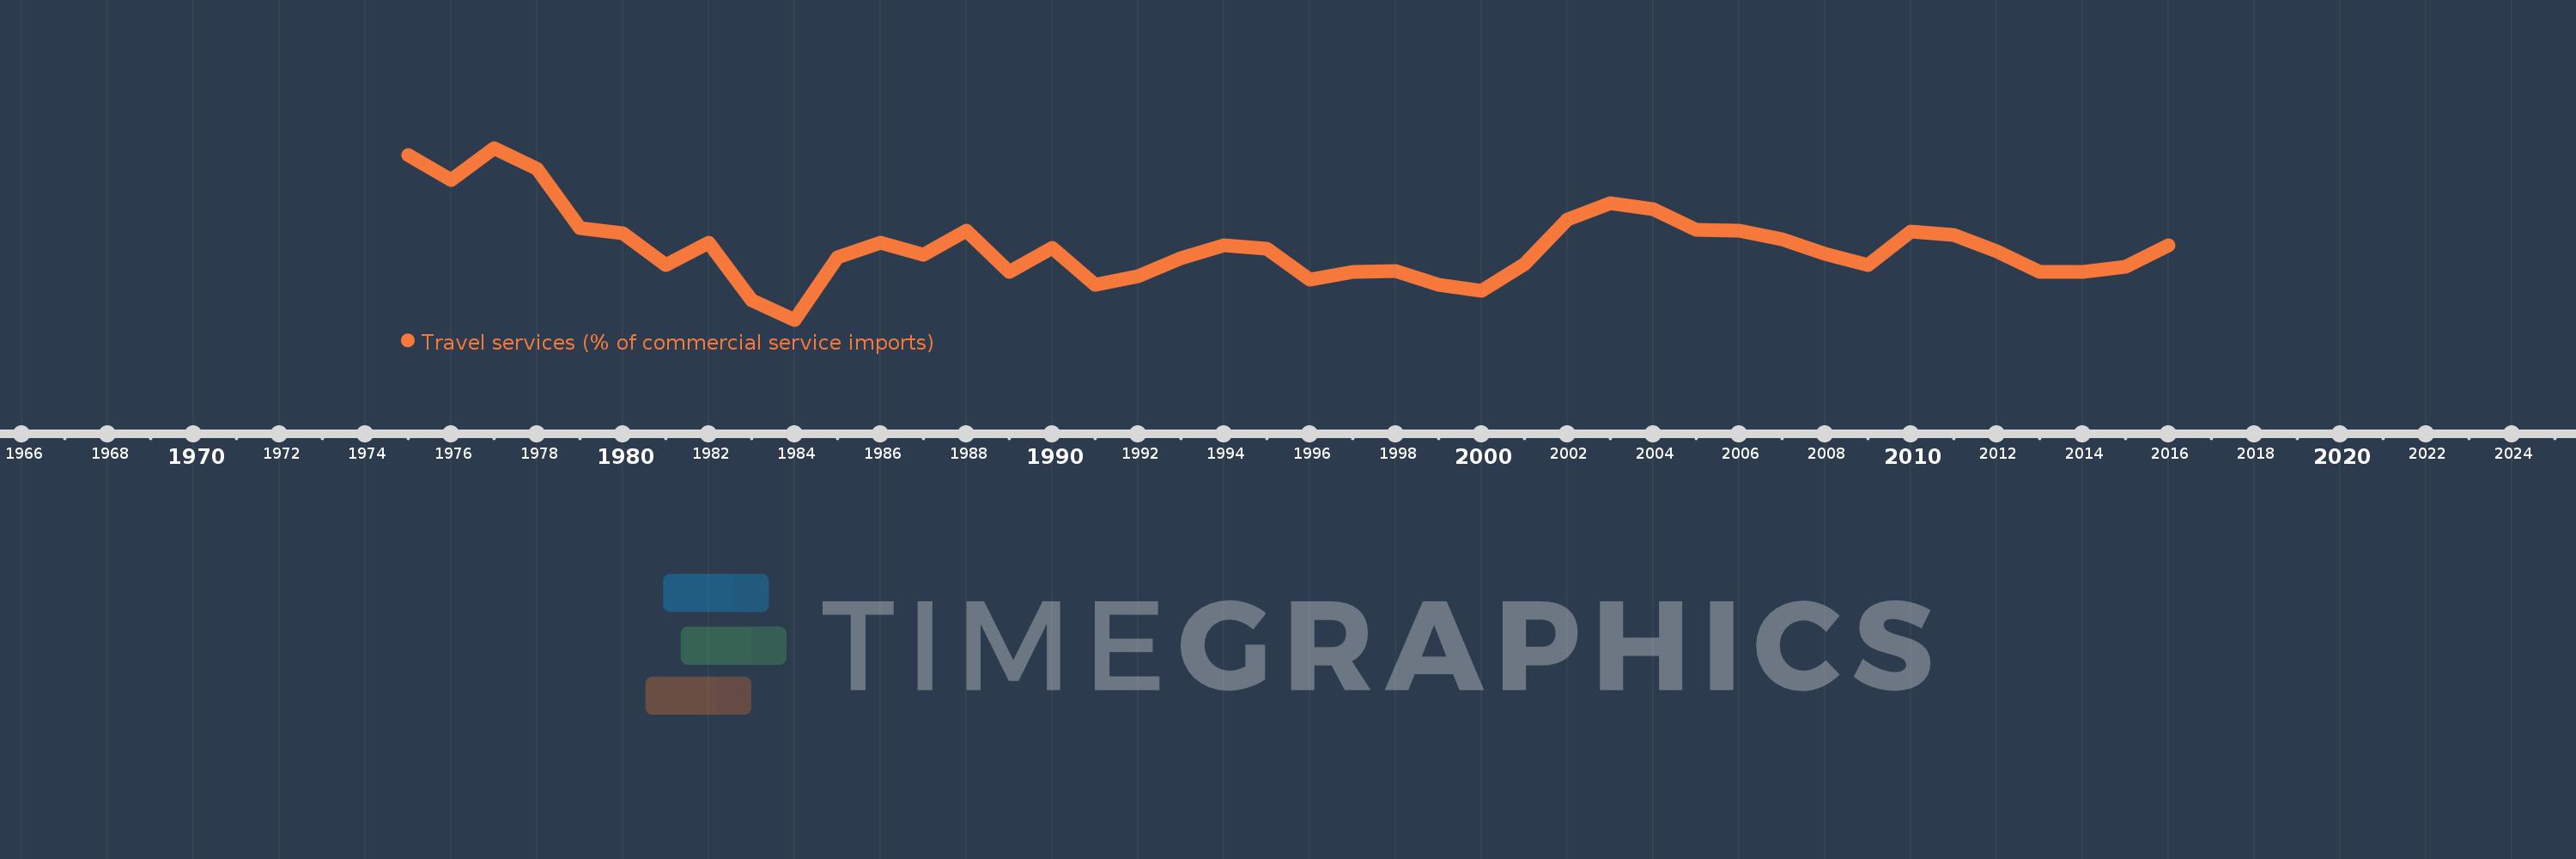
Travel services (% of commercial service imports)
2016,2015,2014,2013,2012,2011,2010,2009,2008,2007,2006,2005,2004,2003,2002,2001,2000,1999,1998,1997,1996,1995,1994,1993,1992,1991,1990,1989,1988,1987,1986,1985,1984,1983,1982,1981,1980,1979,1978,1977,1976,1975
Cette statistique dans les autres pays:
AfghanistanAlbaniaAlgeriaAngolaAntigua and BarbudaArab WorldArgentinaArmeniaArubaAustraliaAustriaAzerbaijanBahamas, TheBahrainBangladeshBarbadosBelarusBelgiumBelizeBeninBermudaBhutanBoliviaBosnia and HerzegovinaBotswanaBrazilBrunei DarussalamBulgariaBurkina FasoBurundiCabo VerdeCambodiaCameroonCanadaCaribbean small statesCentral African RepublicCentral Europe and the BalticsChadChileChinaColombiaComorosCongo, Dem. Rep.Congo, Rep.Costa RicaCote d'IvoireCroatiaCuracaoCyprusCzech RepublicDenmarkDjiboutiDominicaDominican RepublicEarly-demographic dividendEast Asia & PacificEast Asia & Pacific (excluding high income)East Asia & Pacific (IDA & IBRD countries)EcuadorEgypt, Arab Rep.El SalvadorEritreaEstoniaEthiopiaEuro areaEurope & Central AsiaEurope & Central Asia (excluding high income)Europe & Central Asia (IDA & IBRD countries)European UnionFaroe IslandsFijiFinlandFragile and conflict affected situationsFranceFrench PolynesiaGabonGambia, TheGeorgiaGermanyGhanaGreeceGrenadaGuatemalaGuineaGuinea-BissauGuyanaHaitiHeavily indebted poor countries (HIPC)High incomeHondurasHong Kong SAR, ChinaHungaryIBRD onlyIcelandIDA & IBRD totalIDA onlyIDA totalIndiaIndonesiaIran, Islamic Rep.IraqIrelandIsraelItalyJamaicaJapanJordanKazakhstanKenyaKiribatiKorea, Rep.KosovoKuwaitKyrgyz RepublicLao PDRLate-demographic dividendLatin America & Caribbean Latin America & Caribbean (excluding high income)Latin America & the Caribbean (IDA & IBRD countries)LatviaLeast developed countries: UN classificationLebanonLesothoLiberiaLibyaLithuaniaLow & middle incomeLow incomeLower middle incomeLuxembourgMacao SAR, ChinaMacedonia, FYRMadagascarMalawiMalaysiaMaldivesMaliMaltaMarshall IslandsMauritaniaMauritiusMexicoMicronesia, Fed. Sts.Middle East & North AfricaMiddle East & North Africa (excluding high income)Middle East & North Africa (IDA & IBRD countries)Middle incomeMoldovaMongoliaMontenegroMoroccoMozambiqueMyanmarNamibiaNepalNetherlandsNew CaledoniaNew ZealandNicaraguaNigerNigeriaNorth AmericaNorwayOECD membersOmanOther small statesPacific island small statesPakistanPalauPanamaPapua New GuineaParaguayPeruPhilippinesPolandPortugalPost-demographic dividendPre-demographic dividendQatarRomaniaRussian FederationRwandaSamoaSao Tome and PrincipeSaudi ArabiaSenegalSerbiaSeychellesSierra LeoneSingaporeSint Maarten (Dutch part)Slovak RepublicSloveniaSmall statesSolomon IslandsSouth AfricaSouth AsiaSouth Asia (IDA & IBRD)South SudanSpainSri LankaSt. Kitts and NevisSt. LuciaSt. Vincent and the GrenadinesSub-Saharan Africa Sub-Saharan Africa (excluding high income)Sub-Saharan Africa (IDA & IBRD countries)SudanSurinameSwazilandSwedenSwitzerlandSyrian Arab RepublicTajikistanTanzaniaThailandTimor-LesteTogoTongaTrinidad and TobagoTunisiaTurkeyTuvaluUgandaUkraineUnited KingdomUnited StatesUpper middle incomeUruguayVanuatuVenezuela, RBWest Bank and GazaWorldYemen, Rep.ZambiaZimbabwe La ligne de temps
Cette échelle de temps montre un graphique de 1975 année à 2016 année Turkey. Les données jusqu'à 1974 année ne sont pas présentés. Quantité d'observations actuelles selon dates: 42.
Source (désignation):
Les indicateurs du développement mondiale
Source (organisation):
International Monetary Fund, Balance of Payments Statistics Yearbook and data files.
Catégories:
Private Sector, Trade
Dernière mise à jour
23 avr. 2017
Les indicateurs de changement de valeurs selon les années
Minimum:
11.929
1 janv. 1984
Maximum:
44.495
1 janv. 1977
Pour la date d''observation
Valeur
Changement absolu
Le changement par rapport à la valeur précédente
1 janv. 1975
43.087
+43.087
0.0%
1 janv. 1976
38.441
-4.646
-10.78%
1 janv. 1977
44.495
+6.055
15.75%
1 janv. 1978
40.61
-3.885
-8.73%
1 janv. 1979
29.339
-11.271
-27.75%
1 janv. 1980
28.328
-1.011
-3.45%
1 janv. 1981
22.318
-6.01
-21.22%
1 janv. 1982
26.615
+4.297
19.26%
1 janv. 1983
15.684
-10.931
-41.07%
1 janv. 1984
11.929
-3.755
-23.94%
1 janv. 1985
23.695
+11.766
98.63%
1 janv. 1986
26.471
+2.775
11.71%
1 janv. 1987
24.301
-2.169
-8.2%
1 janv. 1988
28.81
+4.509
18.55%
1 janv. 1989
21.046
-7.764
-26.95%
1 janv. 1990
25.589
+4.542
21.58%
1 janv. 1991
18.611
-6.977
-27.27%
1 janv. 1992
20.198
+1.587
8.52%
1 janv. 1993
23.68
+3.482
17.24%
1 janv. 1994
26.009
+2.329
9.84%
1 janv. 1995
25.336
-0.673
-2.59%
1 janv. 1996
19.575
-5.762
-22.74%
1 janv. 1997
20.965
+1.39
7.1%
1 janv. 1998
21.224
+0.26
1.24%
1 janv. 1999
18.582
-2.642
-12.45%
1 janv. 2000
17.41
-1.172
-6.31%
1 janv. 2001
22.469
+5.058
29.05%
1 janv. 2002
30.854
+8.385
37.32%
1 janv. 2003
34.101
+3.247
10.52%
1 janv. 2004
32.928
-1.173
-3.44%
1 janv. 2005
28.94
-3.988
-12.11%
1 janv. 2006
28.858
-0.082
-0.28%
1 janv. 2007
27.131
-1.728
-5.99%
1 janv. 2008
24.436
-2.695
-9.93%
1 janv. 2009
22.373
-2.063
-8.44%
1 janv. 2010
28.646
+6.273
28.04%
1 janv. 2011
28.065
-0.581
-2.03%
1 janv. 2012
24.946
-3.119
-11.11%
1 janv. 2013
21.079
-3.867
-15.5%
1 janv. 2014
20.927
-0.152
-0.72%
1 janv. 2015
22.001
+1.073
5.13%
1 janv. 2016
25.983
+3.982
18.1%
Classement des pays selon les statistiques actuelles par années


Commentaires: