29
/fr/
fr
AIzaSyAYiBZKx7MnpbEhh9jyipgxe19OcubqV5w
April 1, 2024
127035
El Salvador
SLV
true
2
1
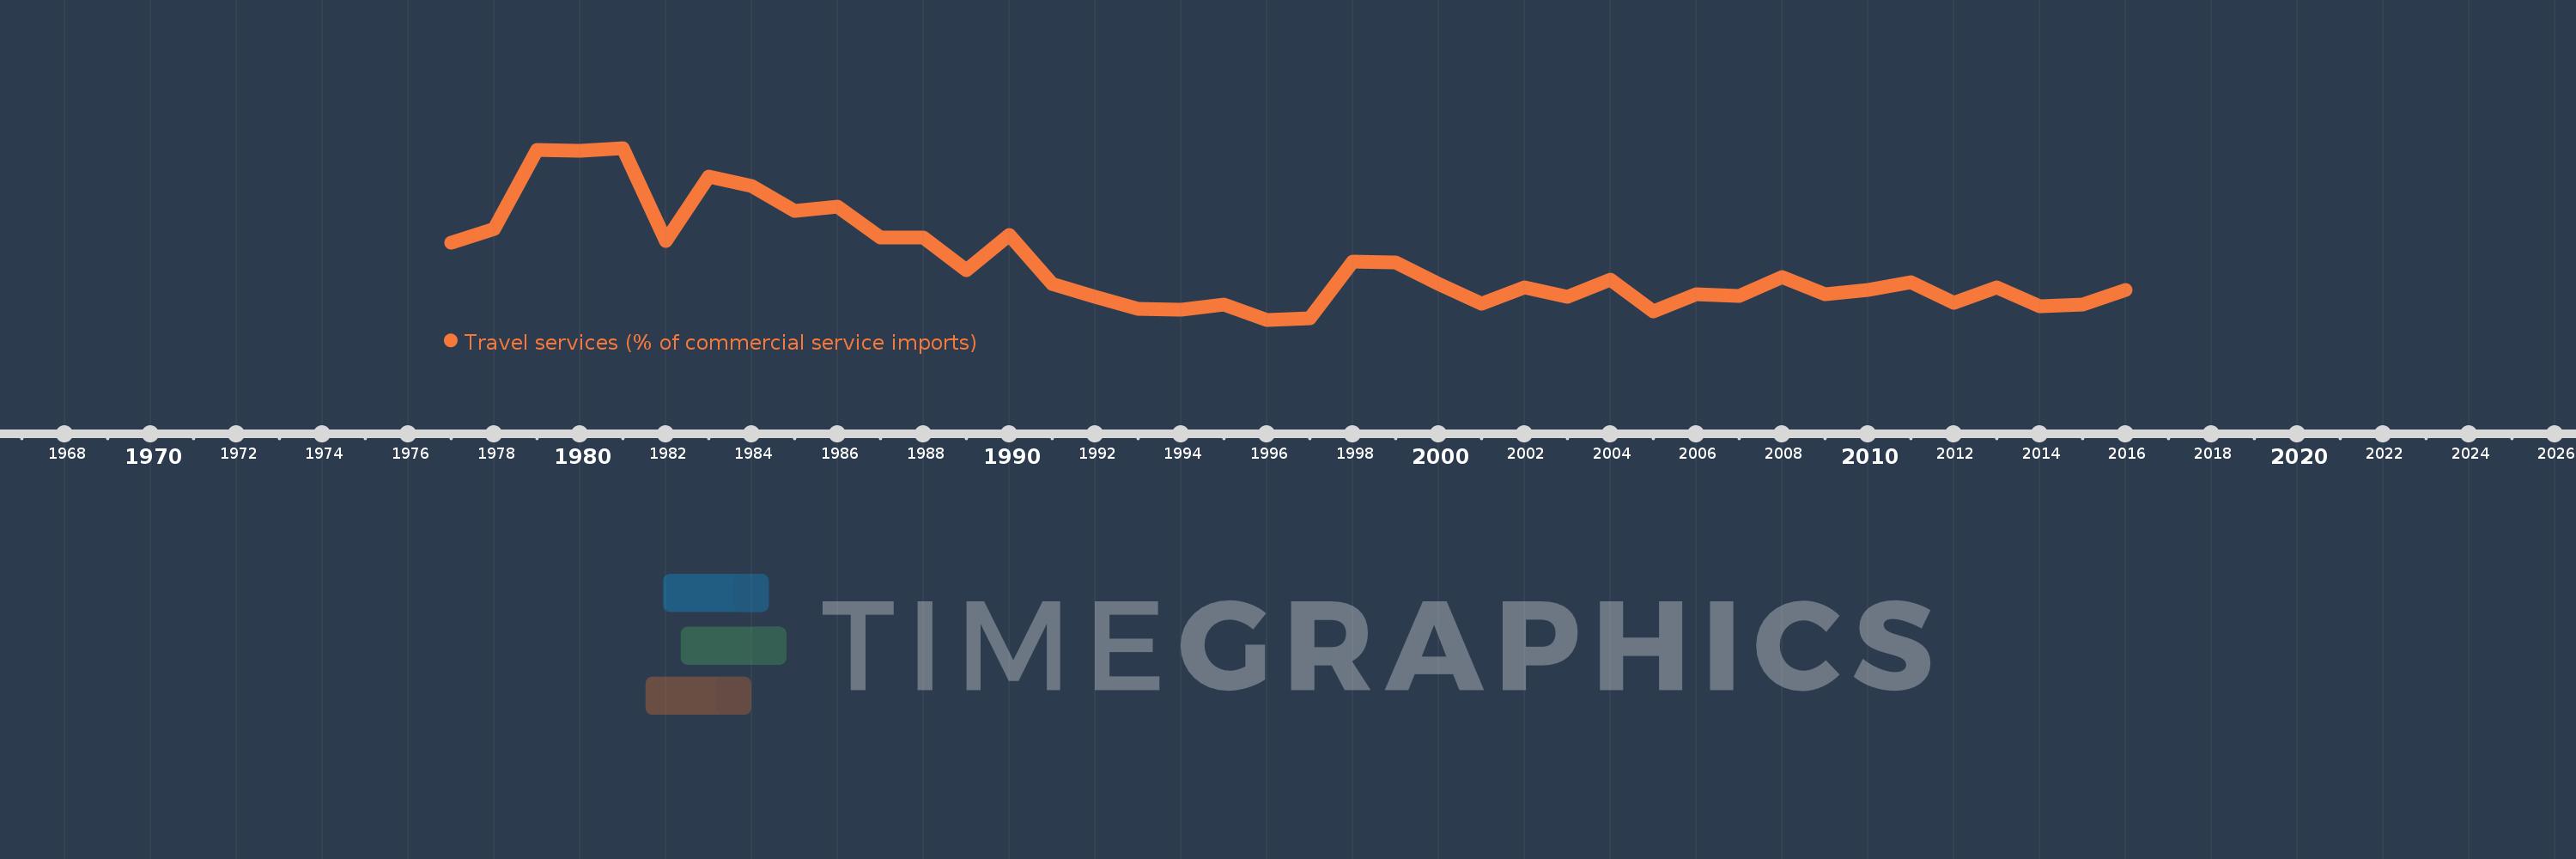
Travel services (% of commercial service imports)
2016,2015,2014,2013,2012,2011,2010,2009,2008,2007,2006,2005,2004,2003,2002,2001,2000,1999,1998,1997,1996,1995,1994,1993,1992,1991,1990,1989,1988,1987,1986,1985,1984,1983,1982,1981,1980,1979,1978,1977
Cette statistique dans les autres pays:
AfghanistanAlbaniaAlgeriaAngolaAntigua and BarbudaArab WorldArgentinaArmeniaArubaAustraliaAustriaAzerbaijanBahamas, TheBahrainBangladeshBarbadosBelarusBelgiumBelizeBeninBermudaBhutanBoliviaBosnia and HerzegovinaBotswanaBrazilBrunei DarussalamBulgariaBurkina FasoBurundiCabo VerdeCambodiaCameroonCanadaCaribbean small statesCentral African RepublicCentral Europe and the BalticsChadChileChinaColombiaComorosCongo, Dem. Rep.Congo, Rep.Costa RicaCote d'IvoireCroatiaCuracaoCyprusCzech RepublicDenmarkDjiboutiDominicaDominican RepublicEarly-demographic dividendEast Asia & PacificEast Asia & Pacific (excluding high income)East Asia & Pacific (IDA & IBRD countries)EcuadorEgypt, Arab Rep.El SalvadorEritreaEstoniaEthiopiaEuro areaEurope & Central AsiaEurope & Central Asia (excluding high income)Europe & Central Asia (IDA & IBRD countries)European UnionFaroe IslandsFijiFinlandFragile and conflict affected situationsFranceFrench PolynesiaGabonGambia, TheGeorgiaGermanyGhanaGreeceGrenadaGuatemalaGuineaGuinea-BissauGuyanaHaitiHeavily indebted poor countries (HIPC)High incomeHondurasHong Kong SAR, ChinaHungaryIBRD onlyIcelandIDA & IBRD totalIDA onlyIDA totalIndiaIndonesiaIran, Islamic Rep.IraqIrelandIsraelItalyJamaicaJapanJordanKazakhstanKenyaKiribatiKorea, Rep.KosovoKuwaitKyrgyz RepublicLao PDRLate-demographic dividendLatin America & Caribbean Latin America & Caribbean (excluding high income)Latin America & the Caribbean (IDA & IBRD countries)LatviaLeast developed countries: UN classificationLebanonLesothoLiberiaLibyaLithuaniaLow & middle incomeLow incomeLower middle incomeLuxembourgMacao SAR, ChinaMacedonia, FYRMadagascarMalawiMalaysiaMaldivesMaliMaltaMarshall IslandsMauritaniaMauritiusMexicoMicronesia, Fed. Sts.Middle East & North AfricaMiddle East & North Africa (excluding high income)Middle East & North Africa (IDA & IBRD countries)Middle incomeMoldovaMongoliaMontenegroMoroccoMozambiqueMyanmarNamibiaNepalNetherlandsNew CaledoniaNew ZealandNicaraguaNigerNigeriaNorth AmericaNorwayOECD membersOmanOther small statesPacific island small statesPakistanPalauPanamaPapua New GuineaParaguayPeruPhilippinesPolandPortugalPost-demographic dividendPre-demographic dividendQatarRomaniaRussian FederationRwandaSamoaSao Tome and PrincipeSaudi ArabiaSenegalSerbiaSeychellesSierra LeoneSingaporeSint Maarten (Dutch part)Slovak RepublicSloveniaSmall statesSolomon IslandsSouth AfricaSouth AsiaSouth Asia (IDA & IBRD)South SudanSpainSri LankaSt. Kitts and NevisSt. LuciaSt. Vincent and the GrenadinesSub-Saharan Africa Sub-Saharan Africa (excluding high income)Sub-Saharan Africa (IDA & IBRD countries)SudanSurinameSwazilandSwedenSwitzerlandSyrian Arab RepublicTajikistanTanzaniaThailandTimor-LesteTogoTongaTrinidad and TobagoTunisiaTurkeyTuvaluUgandaUkraineUnited KingdomUnited StatesUpper middle incomeUruguayVanuatuVenezuela, RBWest Bank and GazaWorldYemen, Rep.ZambiaZimbabwe La ligne de temps
Cette échelle de temps montre un graphique de 1977 année à 2016 année El Salvador. Les données jusqu'à 1976 année ne sont pas présentés. Quantité d'observations actuelles selon dates: 40.
Source (désignation):
Les indicateurs du développement mondiale
Source (organisation):
International Monetary Fund, Balance of Payments Statistics Yearbook and data files.
Catégories:
Private Sector, Trade
Dernière mise à jour
23 avr. 2017
Les indicateurs de changement de valeurs selon les années
Minimum:
14.851
1 janv. 1996
Maximum:
42.223
1 janv. 1981
Pour la date d''observation
Valeur
Changement absolu
Le changement par rapport à la valeur précédente
1 janv. 1977
27.118
+27.118
0.0%
1 janv. 1978
29.335
+2.218
8.18%
1 janv. 1979
41.899
+12.564
42.83%
1 janv. 1980
41.774
-0.126
-0.3%
1 janv. 1981
42.223
+0.449
1.07%
1 janv. 1982
27.368
-14.855
-35.18%
1 janv. 1983
37.652
+10.284
37.58%
1 janv. 1984
36.181
-1.472
-3.91%
1 janv. 1985
32.251
-3.93
-10.86%
1 janv. 1986
32.93
+0.679
2.11%
1 janv. 1987
27.98
-4.949
-15.03%
1 janv. 1988
27.96
-0.02
-0.07%
1 janv. 1989
22.766
-5.195
-18.58%
1 janv. 1990
28.404
+5.639
24.77%
1 janv. 1991
20.548
-7.856
-27.66%
1 janv. 1992
18.474
-2.073
-10.09%
1 janv. 1993
16.638
-1.836
-9.94%
1 janv. 1994
16.434
-0.204
-1.23%
1 janv. 1995
17.218
+0.784
4.77%
1 janv. 1996
14.851
-2.367
-13.75%
1 janv. 1997
15.116
+0.265
1.78%
1 janv. 1998
24.136
+9.02
59.67%
1 janv. 1999
23.959
-0.177
-0.73%
1 janv. 2000
20.522
-3.437
-14.34%
1 janv. 2001
17.439
-3.083
-15.02%
1 janv. 2002
19.973
+2.534
14.53%
1 janv. 2003
18.545
-1.428
-7.15%
1 janv. 2004
21.29
+2.745
14.8%
1 janv. 2005
16.183
-5.107
-23.99%
1 janv. 2006
18.857
+2.674
16.52%
1 janv. 2007
18.582
-0.275
-1.46%
1 janv. 2008
21.585
+3.003
16.16%
1 janv. 2009
18.849
-2.736
-12.68%
1 janv. 2010
19.607
+0.758
4.02%
1 janv. 2011
20.767
+1.16
5.91%
1 janv. 2012
17.582
-3.185
-15.34%
1 janv. 2013
20.052
+2.47
14.05%
1 janv. 2014
16.941
-3.111
-15.51%
1 janv. 2015
17.325
+0.384
2.27%
1 janv. 2016
19.64
+2.314
13.36%
Classement des pays selon les statistiques actuelles par années


Commentaires: