29
/fr/
fr
AIzaSyAYiBZKx7MnpbEhh9jyipgxe19OcubqV5w
April 1, 2024
186018
Madagascar
MDG
true
2
1
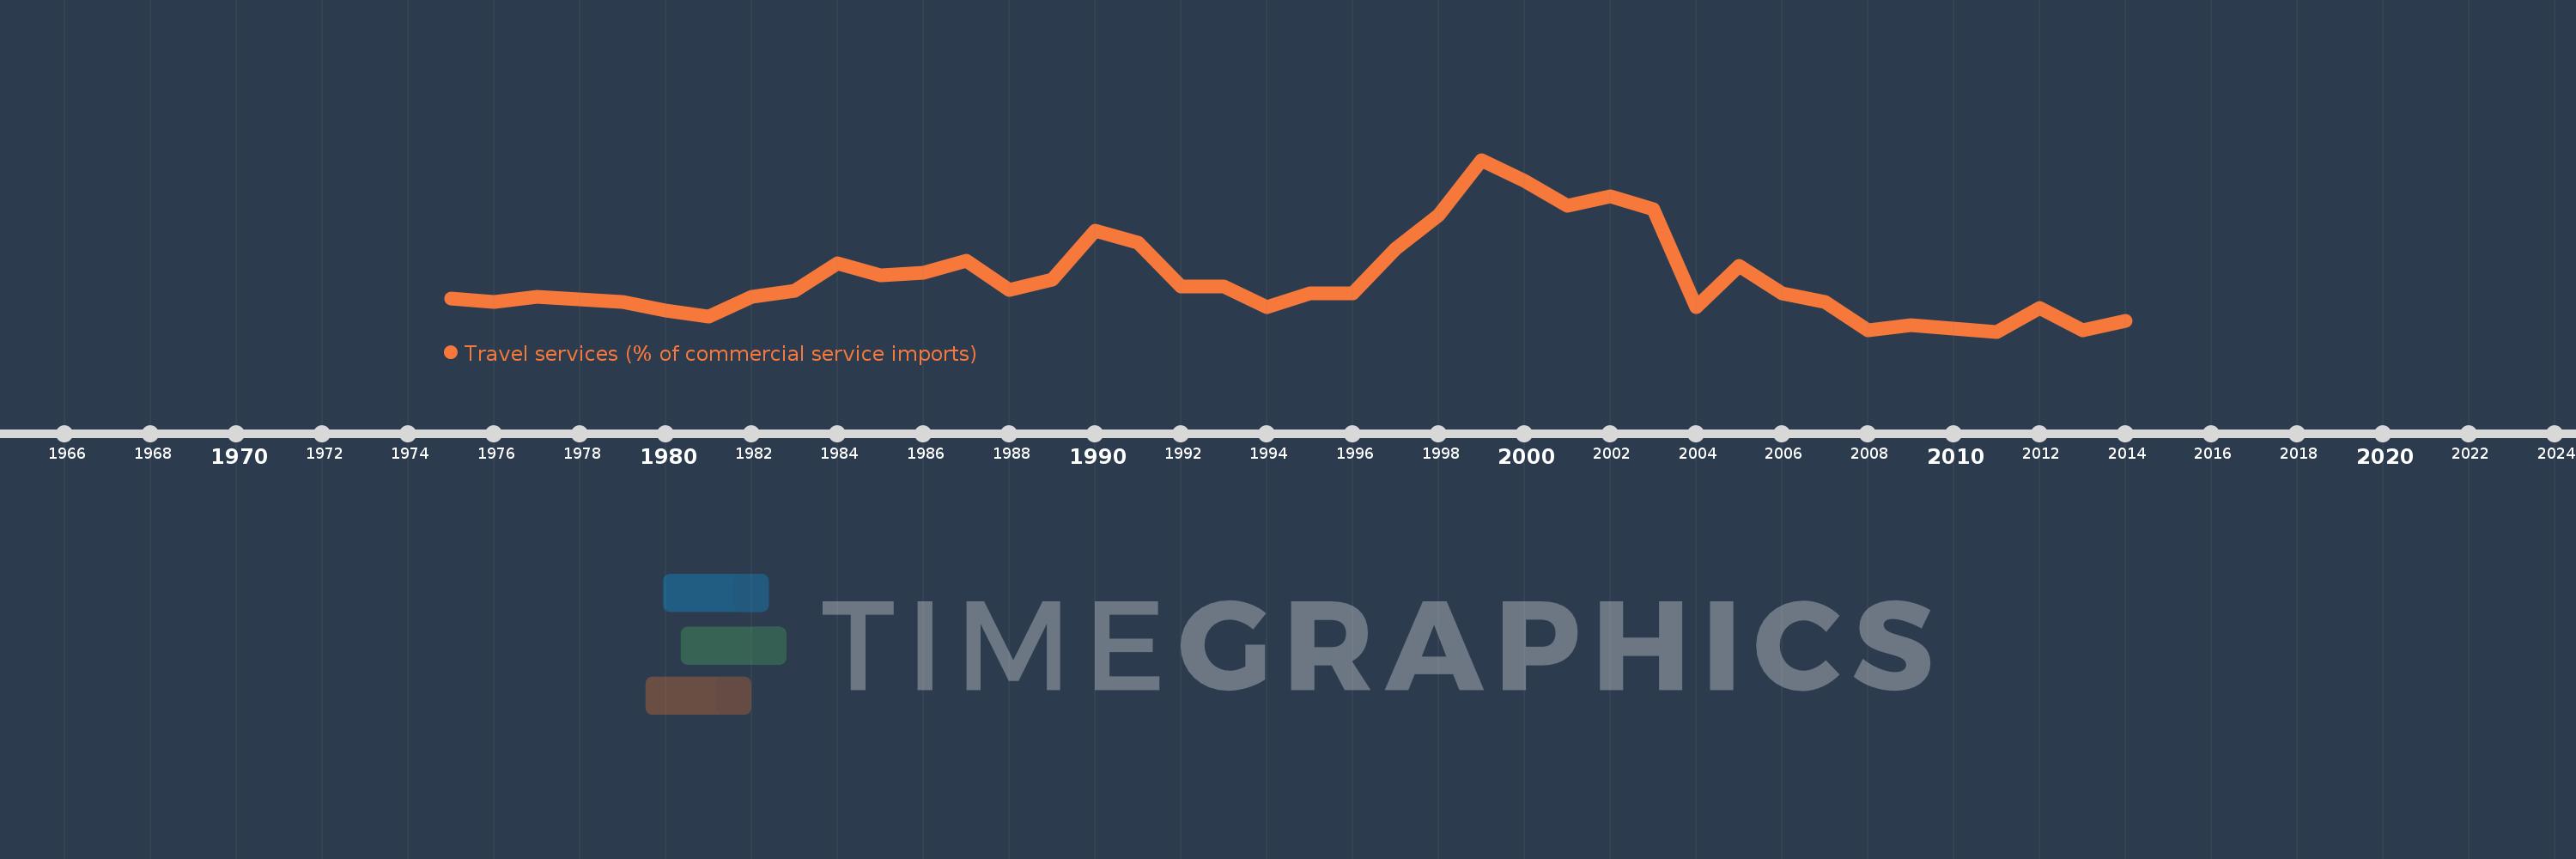
Travel services (% of commercial service imports)
2014,2013,2012,2011,2010,2009,2008,2007,2006,2005,2004,2003,2002,2001,2000,1999,1998,1997,1996,1995,1994,1993,1992,1991,1990,1989,1988,1987,1986,1985,1984,1983,1982,1981,1980,1979,1978,1977,1976,1975
Cette statistique dans les autres pays:
AfghanistanAlbaniaAlgeriaAngolaAntigua and BarbudaArab WorldArgentinaArmeniaArubaAustraliaAustriaAzerbaijanBahamas, TheBahrainBangladeshBarbadosBelarusBelgiumBelizeBeninBermudaBhutanBoliviaBosnia and HerzegovinaBotswanaBrazilBrunei DarussalamBulgariaBurkina FasoBurundiCabo VerdeCambodiaCameroonCanadaCaribbean small statesCentral African RepublicCentral Europe and the BalticsChadChileChinaColombiaComorosCongo, Dem. Rep.Congo, Rep.Costa RicaCote d'IvoireCroatiaCuracaoCyprusCzech RepublicDenmarkDjiboutiDominicaDominican RepublicEarly-demographic dividendEast Asia & PacificEast Asia & Pacific (excluding high income)East Asia & Pacific (IDA & IBRD countries)EcuadorEgypt, Arab Rep.El SalvadorEritreaEstoniaEthiopiaEuro areaEurope & Central AsiaEurope & Central Asia (excluding high income)Europe & Central Asia (IDA & IBRD countries)European UnionFaroe IslandsFijiFinlandFragile and conflict affected situationsFranceFrench PolynesiaGabonGambia, TheGeorgiaGermanyGhanaGreeceGrenadaGuatemalaGuineaGuinea-BissauGuyanaHaitiHeavily indebted poor countries (HIPC)High incomeHondurasHong Kong SAR, ChinaHungaryIBRD onlyIcelandIDA & IBRD totalIDA onlyIDA totalIndiaIndonesiaIran, Islamic Rep.IraqIrelandIsraelItalyJamaicaJapanJordanKazakhstanKenyaKiribatiKorea, Rep.KosovoKuwaitKyrgyz RepublicLao PDRLate-demographic dividendLatin America & Caribbean Latin America & Caribbean (excluding high income)Latin America & the Caribbean (IDA & IBRD countries)LatviaLeast developed countries: UN classificationLebanonLesothoLiberiaLibyaLithuaniaLow & middle incomeLow incomeLower middle incomeLuxembourgMacao SAR, ChinaMacedonia, FYRMadagascarMalawiMalaysiaMaldivesMaliMaltaMarshall IslandsMauritaniaMauritiusMexicoMicronesia, Fed. Sts.Middle East & North AfricaMiddle East & North Africa (excluding high income)Middle East & North Africa (IDA & IBRD countries)Middle incomeMoldovaMongoliaMontenegroMoroccoMozambiqueMyanmarNamibiaNepalNetherlandsNew CaledoniaNew ZealandNicaraguaNigerNigeriaNorth AmericaNorwayOECD membersOmanOther small statesPacific island small statesPakistanPalauPanamaPapua New GuineaParaguayPeruPhilippinesPolandPortugalPost-demographic dividendPre-demographic dividendQatarRomaniaRussian FederationRwandaSamoaSao Tome and PrincipeSaudi ArabiaSenegalSerbiaSeychellesSierra LeoneSingaporeSint Maarten (Dutch part)Slovak RepublicSloveniaSmall statesSolomon IslandsSouth AfricaSouth AsiaSouth Asia (IDA & IBRD)South SudanSpainSri LankaSt. Kitts and NevisSt. LuciaSt. Vincent and the GrenadinesSub-Saharan Africa Sub-Saharan Africa (excluding high income)Sub-Saharan Africa (IDA & IBRD countries)SudanSurinameSwazilandSwedenSwitzerlandSyrian Arab RepublicTajikistanTanzaniaThailandTimor-LesteTogoTongaTrinidad and TobagoTunisiaTurkeyTuvaluUgandaUkraineUnited KingdomUnited StatesUpper middle incomeUruguayVanuatuVenezuela, RBWest Bank and GazaWorldYemen, Rep.ZambiaZimbabwe La ligne de temps
Cette échelle de temps montre un graphique de 1975 année à 2014 année Madagascar. Les données jusqu'à 1974 année ne sont pas présentés. Quantité d'observations actuelles selon dates: 40.
Source (désignation):
Les indicateurs du développement mondiale
Source (organisation):
International Monetary Fund, Balance of Payments Statistics Yearbook and data files.
Catégories:
Private Sector, Trade
Dernière mise à jour
23 avr. 2017
Les indicateurs de changement de valeurs selon les années
Minimum:
9.485
1 janv. 2011
Maximum:
36.333
1 janv. 1999
Pour la date d''observation
Valeur
Changement absolu
Le changement par rapport à la valeur précédente
1 janv. 1975
14.642
+14.642
0.0%
1 janv. 1976
14.112
-0.53
-3.62%
1 janv. 1977
14.982
+0.87
6.17%
1 janv. 1978
14.474
-0.508
-3.39%
1 janv. 1979
14.099
-0.375
-2.59%
1 janv. 1980
12.726
-1.373
-9.74%
1 janv. 1981
11.855
-0.871
-6.84%
1 janv. 1982
14.923
+3.068
25.88%
1 janv. 1983
15.928
+1.004
6.73%
1 janv. 1984
20.209
+4.281
26.88%
1 janv. 1985
18.242
-1.967
-9.73%
1 janv. 1986
18.735
+0.493
2.7%
1 janv. 1987
20.523
+1.788
9.54%
1 janv. 1988
16.046
-4.477
-21.81%
1 janv. 1989
17.664
+1.618
10.08%
1 janv. 1990
25.252
+7.587
42.95%
1 janv. 1991
23.444
-1.808
-7.16%
1 janv. 1992
16.503
-6.94
-29.6%
1 janv. 1993
16.583
+0.079
0.48%
1 janv. 1994
13.319
-3.263
-19.68%
1 janv. 1995
15.41
+2.09
15.69%
1 janv. 1996
15.521
+0.111
0.72%
1 janv. 1997
22.494
+6.973
44.93%
1 janv. 1998
27.621
+5.127
22.79%
1 janv. 1999
36.333
+8.712
31.54%
1 janv. 2000
33.053
-3.28
-9.03%
1 janv. 2001
29.199
-3.854
-11.66%
1 janv. 2002
30.6
+1.401
4.8%
1 janv. 2003
28.594
-2.006
-6.56%
1 janv. 2004
13.33
-15.264
-53.38%
1 janv. 2005
19.741
+6.411
48.1%
1 janv. 2006
15.452
-4.289
-21.73%
1 janv. 2007
14.086
-1.367
-8.84%
1 janv. 2008
9.622
-4.463
-31.69%
1 janv. 2009
10.429
+0.807
8.39%
1 janv. 2010
9.972
-0.457
-4.38%
1 janv. 2011
9.485
-0.487
-4.89%
1 janv. 2012
13.152
+3.668
38.67%
1 janv. 2013
9.681
-3.471
-26.39%
1 janv. 2014
11.121
+1.439
14.87%
Classement des pays selon les statistiques actuelles par années


Commentaires: