29
/fr/
fr
AIzaSyAYiBZKx7MnpbEhh9jyipgxe19OcubqV5w
April 1, 2024
241055
Singapore
SGP
true
2
1
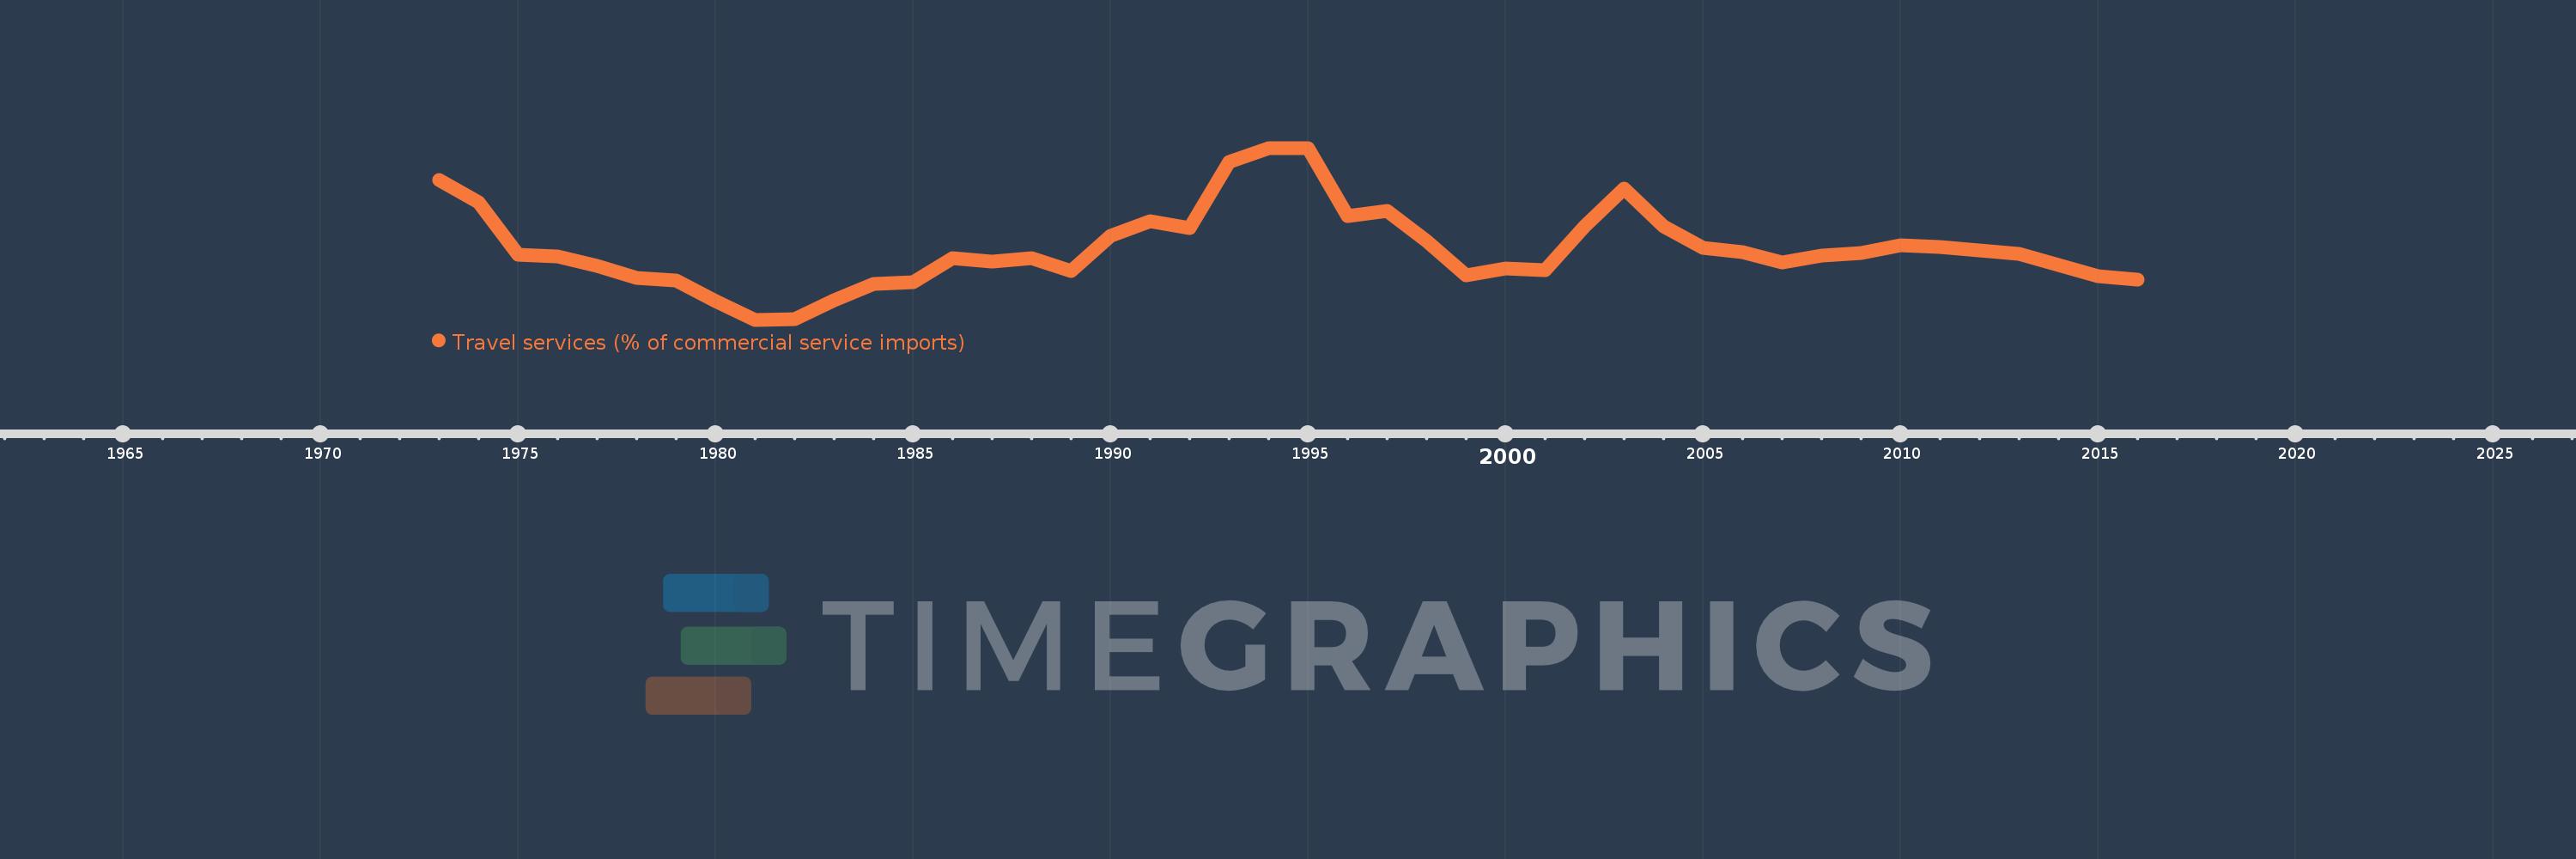
Travel services (% of commercial service imports)
2016,2015,2014,2013,2012,2011,2010,2009,2008,2007,2006,2005,2004,2003,2002,2001,2000,1999,1998,1997,1996,1995,1994,1993,1992,1991,1990,1989,1988,1987,1986,1985,1984,1983,1982,1981,1980,1979,1978,1977,1976,1975,1974,1973
Cette statistique dans les autres pays:
AfghanistanAlbaniaAlgeriaAngolaAntigua and BarbudaArab WorldArgentinaArmeniaArubaAustraliaAustriaAzerbaijanBahamas, TheBahrainBangladeshBarbadosBelarusBelgiumBelizeBeninBermudaBhutanBoliviaBosnia and HerzegovinaBotswanaBrazilBrunei DarussalamBulgariaBurkina FasoBurundiCabo VerdeCambodiaCameroonCanadaCaribbean small statesCentral African RepublicCentral Europe and the BalticsChadChileChinaColombiaComorosCongo, Dem. Rep.Congo, Rep.Costa RicaCote d'IvoireCroatiaCuracaoCyprusCzech RepublicDenmarkDjiboutiDominicaDominican RepublicEarly-demographic dividendEast Asia & PacificEast Asia & Pacific (excluding high income)East Asia & Pacific (IDA & IBRD countries)EcuadorEgypt, Arab Rep.El SalvadorEritreaEstoniaEthiopiaEuro areaEurope & Central AsiaEurope & Central Asia (excluding high income)Europe & Central Asia (IDA & IBRD countries)European UnionFaroe IslandsFijiFinlandFragile and conflict affected situationsFranceFrench PolynesiaGabonGambia, TheGeorgiaGermanyGhanaGreeceGrenadaGuatemalaGuineaGuinea-BissauGuyanaHaitiHeavily indebted poor countries (HIPC)High incomeHondurasHong Kong SAR, ChinaHungaryIBRD onlyIcelandIDA & IBRD totalIDA onlyIDA totalIndiaIndonesiaIran, Islamic Rep.IraqIrelandIsraelItalyJamaicaJapanJordanKazakhstanKenyaKiribatiKorea, Rep.KosovoKuwaitKyrgyz RepublicLao PDRLate-demographic dividendLatin America & Caribbean Latin America & Caribbean (excluding high income)Latin America & the Caribbean (IDA & IBRD countries)LatviaLeast developed countries: UN classificationLebanonLesothoLiberiaLibyaLithuaniaLow & middle incomeLow incomeLower middle incomeLuxembourgMacao SAR, ChinaMacedonia, FYRMadagascarMalawiMalaysiaMaldivesMaliMaltaMarshall IslandsMauritaniaMauritiusMexicoMicronesia, Fed. Sts.Middle East & North AfricaMiddle East & North Africa (excluding high income)Middle East & North Africa (IDA & IBRD countries)Middle incomeMoldovaMongoliaMontenegroMoroccoMozambiqueMyanmarNamibiaNepalNetherlandsNew CaledoniaNew ZealandNicaraguaNigerNigeriaNorth AmericaNorwayOECD membersOmanOther small statesPacific island small statesPakistanPalauPanamaPapua New GuineaParaguayPeruPhilippinesPolandPortugalPost-demographic dividendPre-demographic dividendQatarRomaniaRussian FederationRwandaSamoaSao Tome and PrincipeSaudi ArabiaSenegalSerbiaSeychellesSierra LeoneSingaporeSint Maarten (Dutch part)Slovak RepublicSloveniaSmall statesSolomon IslandsSouth AfricaSouth AsiaSouth Asia (IDA & IBRD)South SudanSpainSri LankaSt. Kitts and NevisSt. LuciaSt. Vincent and the GrenadinesSub-Saharan Africa Sub-Saharan Africa (excluding high income)Sub-Saharan Africa (IDA & IBRD countries)SudanSurinameSwazilandSwedenSwitzerlandSyrian Arab RepublicTajikistanTanzaniaThailandTimor-LesteTogoTongaTrinidad and TobagoTunisiaTurkeyTuvaluUgandaUkraineUnited KingdomUnited StatesUpper middle incomeUruguayVanuatuVenezuela, RBWest Bank and GazaWorldYemen, Rep.ZambiaZimbabwe La ligne de temps
Cette échelle de temps montre un graphique de 1973 année à 2016 année Singapore. Les données jusqu'à 1972 année ne sont pas présentés. Quantité d'observations actuelles selon dates: 44.
Source (désignation):
Les indicateurs du développement mondiale
Source (organisation):
International Monetary Fund, Balance of Payments Statistics Yearbook and data files.
Catégories:
Private Sector, Trade
Dernière mise à jour
23 avr. 2017
Les indicateurs de changement de valeurs selon les années
Minimum:
11.522
1 janv. 1981
Maximum:
28.037
1 janv. 1994
Pour la date d''observation
Valeur
Changement absolu
Le changement par rapport à la valeur précédente
1 janv. 1973
24.926
+24.926
0.0%
1 janv. 1974
22.827
-2.099
-8.42%
1 janv. 1975
17.736
-5.091
-22.3%
1 janv. 1976
17.626
-0.11
-0.62%
1 janv. 1977
16.738
-0.889
-5.04%
1 janv. 1978
15.584
-1.154
-6.89%
1 janv. 1979
15.257
-0.326
-2.09%
1 janv. 1980
13.335
-1.922
-12.6%
1 janv. 1981
11.522
-1.813
-13.59%
1 janv. 1982
11.6
+0.078
0.67%
1 janv. 1983
13.412
+1.812
15.62%
1 janv. 1984
14.993
+1.581
11.79%
1 janv. 1985
15.091
+0.098
0.65%
1 janv. 1986
17.456
+2.365
15.67%
1 janv. 1987
17.12
-0.336
-1.93%
1 janv. 1988
17.404
+0.284
1.66%
1 janv. 1989
16.227
-1.177
-6.76%
1 janv. 1990
19.621
+3.394
20.91%
1 janv. 1991
20.989
+1.369
6.98%
1 janv. 1992
20.362
-0.627
-2.99%
1 janv. 1993
26.657
+6.294
30.91%
1 janv. 1994
28.037
+1.381
5.18%
1 janv. 1995
28.029
-0.008
-0.03%
1 janv. 1996
21.467
-6.562
-23.41%
1 janv. 1997
21.991
+0.525
2.44%
1 janv. 1998
19.057
-2.934
-13.34%
1 janv. 1999
15.806
-3.252
-17.06%
1 janv. 2000
16.475
+0.67
4.24%
1 janv. 2001
16.291
-0.184
-1.12%
1 janv. 2002
20.469
+4.178
25.64%
1 janv. 2003
24.128
+3.66
17.88%
1 janv. 2004
20.468
-3.66
-15.17%
1 janv. 2005
18.411
-2.057
-10.05%
1 janv. 2006
17.987
-0.424
-2.3%
1 janv. 2007
17.022
-0.966
-5.37%
1 janv. 2008
17.699
+0.677
3.98%
1 janv. 2009
17.965
+0.266
1.5%
1 janv. 2010
18.713
+0.749
4.17%
1 janv. 2011
18.511
-0.203
-1.08%
1 janv. 2012
18.224
-0.287
-1.55%
1 janv. 2013
17.868
-0.356
-1.95%
1 janv. 2014
16.755
-1.112
-6.22%
1 janv. 2015
15.691
-1.064
-6.35%
1 janv. 2016
15.395
-0.296
-1.89%
Classement des pays selon les statistiques actuelles par années


Commentaires: