29
/fr/
fr
AIzaSyAYiBZKx7MnpbEhh9jyipgxe19OcubqV5w
April 1, 2024
125653
Egypt, Arab Rep.
EGY
true
2
1
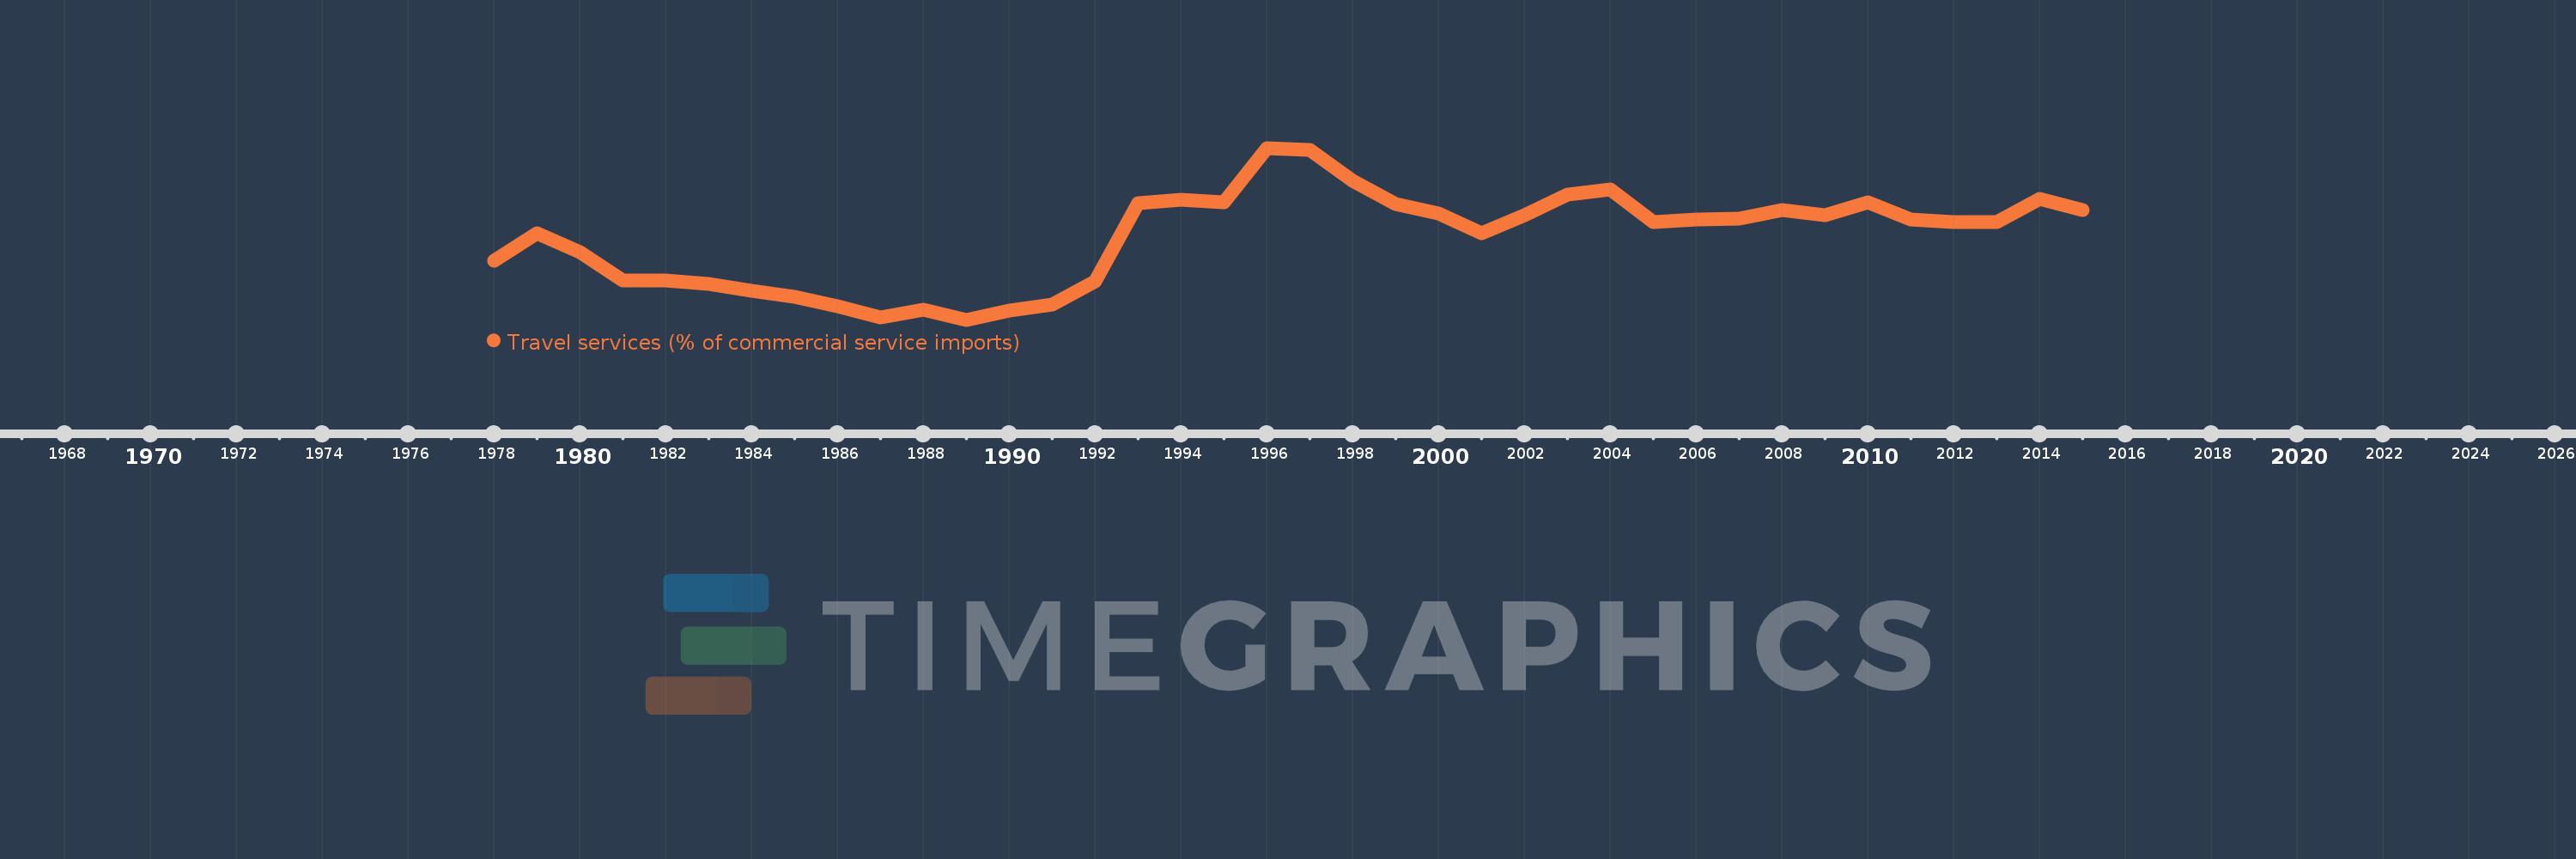
Travel services (% of commercial service imports)
2015,2014,2013,2012,2011,2010,2009,2008,2007,2006,2005,2004,2003,2002,2001,2000,1999,1998,1997,1996,1995,1994,1993,1992,1991,1990,1989,1988,1987,1986,1985,1984,1983,1982,1981,1980,1979,1978
Cette statistique dans les autres pays:
AfghanistanAlbaniaAlgeriaAngolaAntigua and BarbudaArab WorldArgentinaArmeniaArubaAustraliaAustriaAzerbaijanBahamas, TheBahrainBangladeshBarbadosBelarusBelgiumBelizeBeninBermudaBhutanBoliviaBosnia and HerzegovinaBotswanaBrazilBrunei DarussalamBulgariaBurkina FasoBurundiCabo VerdeCambodiaCameroonCanadaCaribbean small statesCentral African RepublicCentral Europe and the BalticsChadChileChinaColombiaComorosCongo, Dem. Rep.Congo, Rep.Costa RicaCote d'IvoireCroatiaCuracaoCyprusCzech RepublicDenmarkDjiboutiDominicaDominican RepublicEarly-demographic dividendEast Asia & PacificEast Asia & Pacific (excluding high income)East Asia & Pacific (IDA & IBRD countries)EcuadorEgypt, Arab Rep.El SalvadorEritreaEstoniaEthiopiaEuro areaEurope & Central AsiaEurope & Central Asia (excluding high income)Europe & Central Asia (IDA & IBRD countries)European UnionFaroe IslandsFijiFinlandFragile and conflict affected situationsFranceFrench PolynesiaGabonGambia, TheGeorgiaGermanyGhanaGreeceGrenadaGuatemalaGuineaGuinea-BissauGuyanaHaitiHeavily indebted poor countries (HIPC)High incomeHondurasHong Kong SAR, ChinaHungaryIBRD onlyIcelandIDA & IBRD totalIDA onlyIDA totalIndiaIndonesiaIran, Islamic Rep.IraqIrelandIsraelItalyJamaicaJapanJordanKazakhstanKenyaKiribatiKorea, Rep.KosovoKuwaitKyrgyz RepublicLao PDRLate-demographic dividendLatin America & Caribbean Latin America & Caribbean (excluding high income)Latin America & the Caribbean (IDA & IBRD countries)LatviaLeast developed countries: UN classificationLebanonLesothoLiberiaLibyaLithuaniaLow & middle incomeLow incomeLower middle incomeLuxembourgMacao SAR, ChinaMacedonia, FYRMadagascarMalawiMalaysiaMaldivesMaliMaltaMarshall IslandsMauritaniaMauritiusMexicoMicronesia, Fed. Sts.Middle East & North AfricaMiddle East & North Africa (excluding high income)Middle East & North Africa (IDA & IBRD countries)Middle incomeMoldovaMongoliaMontenegroMoroccoMozambiqueMyanmarNamibiaNepalNetherlandsNew CaledoniaNew ZealandNicaraguaNigerNigeriaNorth AmericaNorwayOECD membersOmanOther small statesPacific island small statesPakistanPalauPanamaPapua New GuineaParaguayPeruPhilippinesPolandPortugalPost-demographic dividendPre-demographic dividendQatarRomaniaRussian FederationRwandaSamoaSao Tome and PrincipeSaudi ArabiaSenegalSerbiaSeychellesSierra LeoneSingaporeSint Maarten (Dutch part)Slovak RepublicSloveniaSmall statesSolomon IslandsSouth AfricaSouth AsiaSouth Asia (IDA & IBRD)South SudanSpainSri LankaSt. Kitts and NevisSt. LuciaSt. Vincent and the GrenadinesSub-Saharan Africa Sub-Saharan Africa (excluding high income)Sub-Saharan Africa (IDA & IBRD countries)SudanSurinameSwazilandSwedenSwitzerlandSyrian Arab RepublicTajikistanTanzaniaThailandTimor-LesteTogoTongaTrinidad and TobagoTunisiaTurkeyTuvaluUgandaUkraineUnited KingdomUnited StatesUpper middle incomeUruguayVanuatuVenezuela, RBWest Bank and GazaWorldYemen, Rep.ZambiaZimbabwe La ligne de temps
Cette échelle de temps montre un graphique de 1978 année à 2015 année Egypt, Arab Rep.. Les données jusqu'à 1977 année ne sont pas présentés. Quantité d'observations actuelles selon dates: 38.
Source (désignation):
Les indicateurs du développement mondiale
Source (organisation):
International Monetary Fund, Balance of Payments Statistics Yearbook and data files.
Catégories:
Private Sector, Trade
Dernière mise à jour
23 avr. 2017
Les indicateurs de changement de valeurs selon les années
Minimum:
1.554
1 janv. 1989
Maximum:
28.331
1 janv. 1996
Pour la date d''observation
Valeur
Changement absolu
Le changement par rapport à la valeur précédente
1 janv. 1978
10.711
+10.711
0.0%
1 janv. 1979
15.005
+4.293
40.08%
1 janv. 1980
12.154
-2.851
-19.0%
1 janv. 1981
7.699
-4.455
-36.66%
1 janv. 1982
7.674
-0.025
-0.32%
1 janv. 1983
7.131
-0.543
-7.07%
1 janv. 1984
6.007
-1.124
-15.76%
1 janv. 1985
5.15
-0.857
-14.27%
1 janv. 1986
3.713
-1.436
-27.89%
1 janv. 1987
1.915
-1.798
-48.43%
1 janv. 1988
3.135
+1.22
63.71%
1 janv. 1989
1.554
-1.581
-50.42%
1 janv. 1990
3.043
+1.488
95.73%
1 janv. 1991
3.878
+0.835
27.45%
1 janv. 1992
7.505
+3.627
93.53%
1 janv. 1993
19.759
+12.254
163.28%
1 janv. 1994
20.294
+0.535
2.71%
1 janv. 1995
19.825
-0.469
-2.31%
1 janv. 1996
28.331
+8.505
42.9%
1 janv. 1997
27.968
-0.363
-1.28%
1 janv. 1998
23.176
-4.791
-17.13%
1 janv. 1999
19.589
-3.588
-15.48%
1 janv. 2000
18.083
-1.506
-7.69%
1 janv. 2001
14.97
-3.113
-17.21%
1 janv. 2002
17.803
+2.833
18.92%
1 janv. 2003
21.054
+3.251
18.26%
1 janv. 2004
21.877
+0.823
3.91%
1 janv. 2005
16.831
-5.046
-23.06%
1 janv. 2006
17.131
+0.3
1.78%
1 janv. 2007
17.339
+0.208
1.22%
1 janv. 2008
18.689
+1.349
7.78%
1 janv. 2009
17.847
-0.842
-4.5%
1 janv. 2010
19.883
+2.036
11.41%
1 janv. 2011
17.239
-2.644
-13.3%
1 janv. 2012
16.776
-0.463
-2.69%
1 janv. 2013
16.83
+0.055
0.33%
1 janv. 2014
20.351
+3.521
20.92%
1 janv. 2015
18.688
-1.663
-8.17%
Classement des pays selon les statistiques actuelles par années


Commentaires: