29
/fr/
fr
AIzaSyAYiBZKx7MnpbEhh9jyipgxe19OcubqV5w
April 1, 2024
220336
Papua New Guinea
PNG
true
2
1
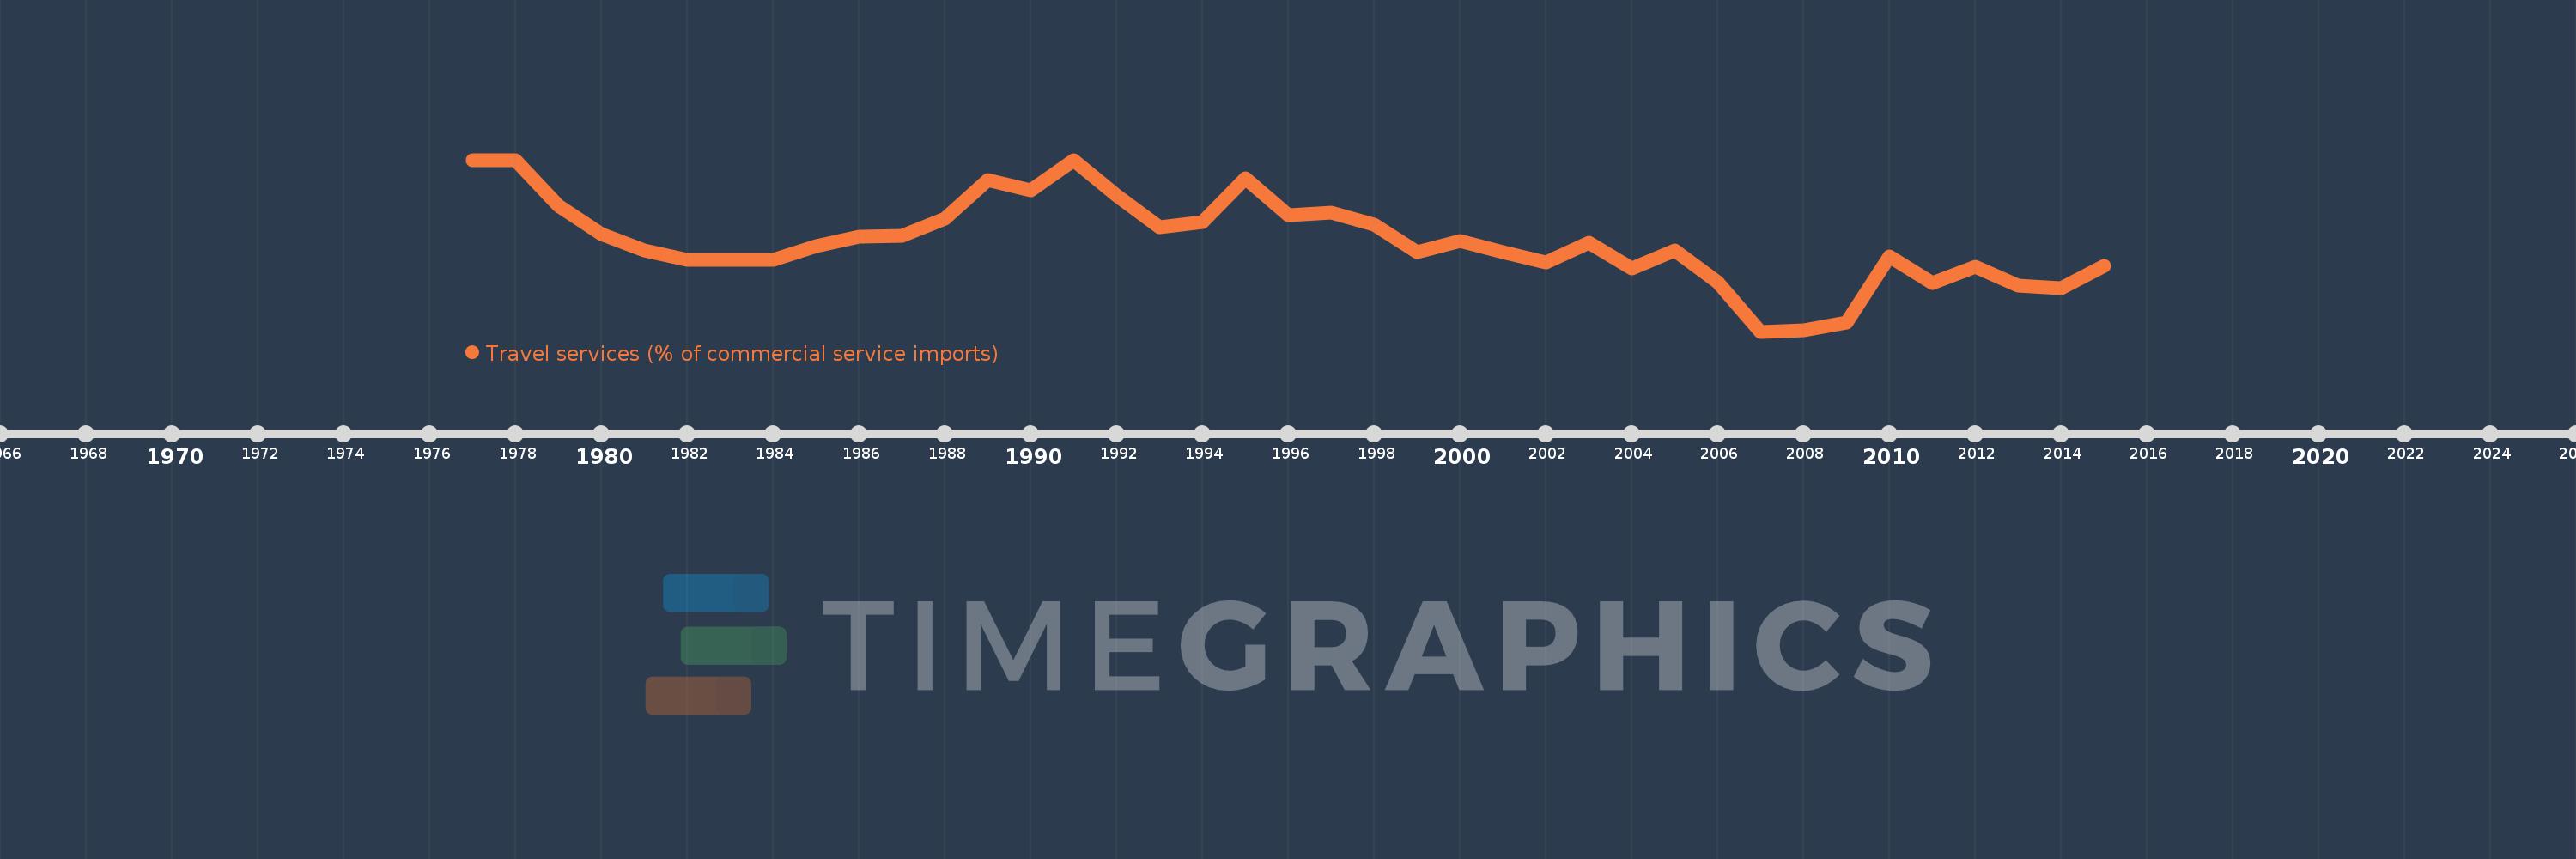
Travel services (% of commercial service imports)
2015,2014,2013,2012,2011,2010,2009,2008,2007,2006,2005,2004,2003,2002,2001,2000,1999,1998,1997,1996,1995,1994,1993,1992,1991,1990,1989,1988,1987,1986,1985,1984,1983,1982,1981,1980,1979,1978,1977
Cette statistique dans les autres pays:
AfghanistanAlbaniaAlgeriaAngolaAntigua and BarbudaArab WorldArgentinaArmeniaArubaAustraliaAustriaAzerbaijanBahamas, TheBahrainBangladeshBarbadosBelarusBelgiumBelizeBeninBermudaBhutanBoliviaBosnia and HerzegovinaBotswanaBrazilBrunei DarussalamBulgariaBurkina FasoBurundiCabo VerdeCambodiaCameroonCanadaCaribbean small statesCentral African RepublicCentral Europe and the BalticsChadChileChinaColombiaComorosCongo, Dem. Rep.Congo, Rep.Costa RicaCote d'IvoireCroatiaCuracaoCyprusCzech RepublicDenmarkDjiboutiDominicaDominican RepublicEarly-demographic dividendEast Asia & PacificEast Asia & Pacific (excluding high income)East Asia & Pacific (IDA & IBRD countries)EcuadorEgypt, Arab Rep.El SalvadorEritreaEstoniaEthiopiaEuro areaEurope & Central AsiaEurope & Central Asia (excluding high income)Europe & Central Asia (IDA & IBRD countries)European UnionFaroe IslandsFijiFinlandFragile and conflict affected situationsFranceFrench PolynesiaGabonGambia, TheGeorgiaGermanyGhanaGreeceGrenadaGuatemalaGuineaGuinea-BissauGuyanaHaitiHeavily indebted poor countries (HIPC)High incomeHondurasHong Kong SAR, ChinaHungaryIBRD onlyIcelandIDA & IBRD totalIDA onlyIDA totalIndiaIndonesiaIran, Islamic Rep.IraqIrelandIsraelItalyJamaicaJapanJordanKazakhstanKenyaKiribatiKorea, Rep.KosovoKuwaitKyrgyz RepublicLao PDRLate-demographic dividendLatin America & Caribbean Latin America & Caribbean (excluding high income)Latin America & the Caribbean (IDA & IBRD countries)LatviaLeast developed countries: UN classificationLebanonLesothoLiberiaLibyaLithuaniaLow & middle incomeLow incomeLower middle incomeLuxembourgMacao SAR, ChinaMacedonia, FYRMadagascarMalawiMalaysiaMaldivesMaliMaltaMarshall IslandsMauritaniaMauritiusMexicoMicronesia, Fed. Sts.Middle East & North AfricaMiddle East & North Africa (excluding high income)Middle East & North Africa (IDA & IBRD countries)Middle incomeMoldovaMongoliaMontenegroMoroccoMozambiqueMyanmarNamibiaNepalNetherlandsNew CaledoniaNew ZealandNicaraguaNigerNigeriaNorth AmericaNorwayOECD membersOmanOther small statesPacific island small statesPakistanPalauPanamaPapua New GuineaParaguayPeruPhilippinesPolandPortugalPost-demographic dividendPre-demographic dividendQatarRomaniaRussian FederationRwandaSamoaSao Tome and PrincipeSaudi ArabiaSenegalSerbiaSeychellesSierra LeoneSingaporeSint Maarten (Dutch part)Slovak RepublicSloveniaSmall statesSolomon IslandsSouth AfricaSouth AsiaSouth Asia (IDA & IBRD)South SudanSpainSri LankaSt. Kitts and NevisSt. LuciaSt. Vincent and the GrenadinesSub-Saharan Africa Sub-Saharan Africa (excluding high income)Sub-Saharan Africa (IDA & IBRD countries)SudanSurinameSwazilandSwedenSwitzerlandSyrian Arab RepublicTajikistanTanzaniaThailandTimor-LesteTogoTongaTrinidad and TobagoTunisiaTurkeyTuvaluUgandaUkraineUnited KingdomUnited StatesUpper middle incomeUruguayVanuatuVenezuela, RBWest Bank and GazaWorldYemen, Rep.ZambiaZimbabwe La ligne de temps
Cette échelle de temps montre un graphique de 1977 année à 2015 année Papua New Guinea. Les données jusqu'à 1976 année ne sont pas présentés. Quantité d'observations actuelles selon dates: 39.
Source (désignation):
Les indicateurs du développement mondiale
Source (organisation):
International Monetary Fund, Balance of Payments Statistics Yearbook and data files.
Catégories:
Private Sector, Trade
Dernière mise à jour
23 avr. 2017
Les indicateurs de changement de valeurs selon les années
Minimum:
0.989
1 janv. 2007
Maximum:
12.896
1 janv. 1977
Pour la date d''observation
Valeur
Changement absolu
Le changement par rapport à la valeur précédente
1 janv. 1977
12.896
+12.896
0.0%
1 janv. 1978
12.851
-0.046
-0.36%
1 janv. 1979
9.736
-3.114
-24.23%
1 janv. 1980
7.757
-1.98
-20.33%
1 janv. 1981
6.619
-1.137
-14.66%
1 janv. 1982
5.964
-0.656
-9.91%
1 janv. 1983
5.931
-0.033
-0.55%
1 janv. 1984
5.936
+0.005
0.08%
1 janv. 1985
6.936
+1.0
16.85%
1 janv. 1986
7.542
+0.607
8.75%
1 janv. 1987
7.615
+0.072
0.96%
1 janv. 1988
8.839
+1.224
16.07%
1 janv. 1989
11.481
+2.643
29.9%
1 janv. 1990
10.81
-0.671
-5.84%
1 janv. 1991
12.839
+2.028
18.76%
1 janv. 1992
10.408
-2.431
-18.93%
1 janv. 1993
8.246
-2.162
-20.77%
1 janv. 1994
8.568
+0.322
3.91%
1 janv. 1995
11.601
+3.033
35.4%
1 janv. 1996
9.068
-2.532
-21.83%
1 janv. 1997
9.252
+0.184
2.03%
1 janv. 1998
8.407
-0.845
-9.13%
1 janv. 1999
6.523
-1.884
-22.41%
1 janv. 2000
7.286
+0.763
11.69%
1 janv. 2001
6.515
-0.772
-10.59%
1 janv. 2002
5.772
-0.743
-11.41%
1 janv. 2003
7.131
+1.36
23.56%
1 janv. 2004
5.392
-1.74
-24.4%
1 janv. 2005
6.614
+1.223
22.68%
1 janv. 2006
4.405
-2.21
-33.41%
1 janv. 2007
0.989
-3.415
-77.54%
1 janv. 2008
1.07
+0.08
8.11%
1 janv. 2009
1.589
+0.52
48.6%
1 janv. 2010
6.203
+4.613
290.25%
1 janv. 2011
4.34
-1.863
-30.03%
1 janv. 2012
5.479
+1.139
26.24%
1 janv. 2013
4.183
-1.295
-23.64%
1 janv. 2014
3.966
-0.218
-5.2%
1 janv. 2015
5.56
+1.594
40.2%
Classement des pays selon les statistiques actuelles par années


Commentaires: