29
/fr/
fr
AIzaSyAYiBZKx7MnpbEhh9jyipgxe19OcubqV5w
April 1, 2024
267592
Tunisia
TUN
true
2
1
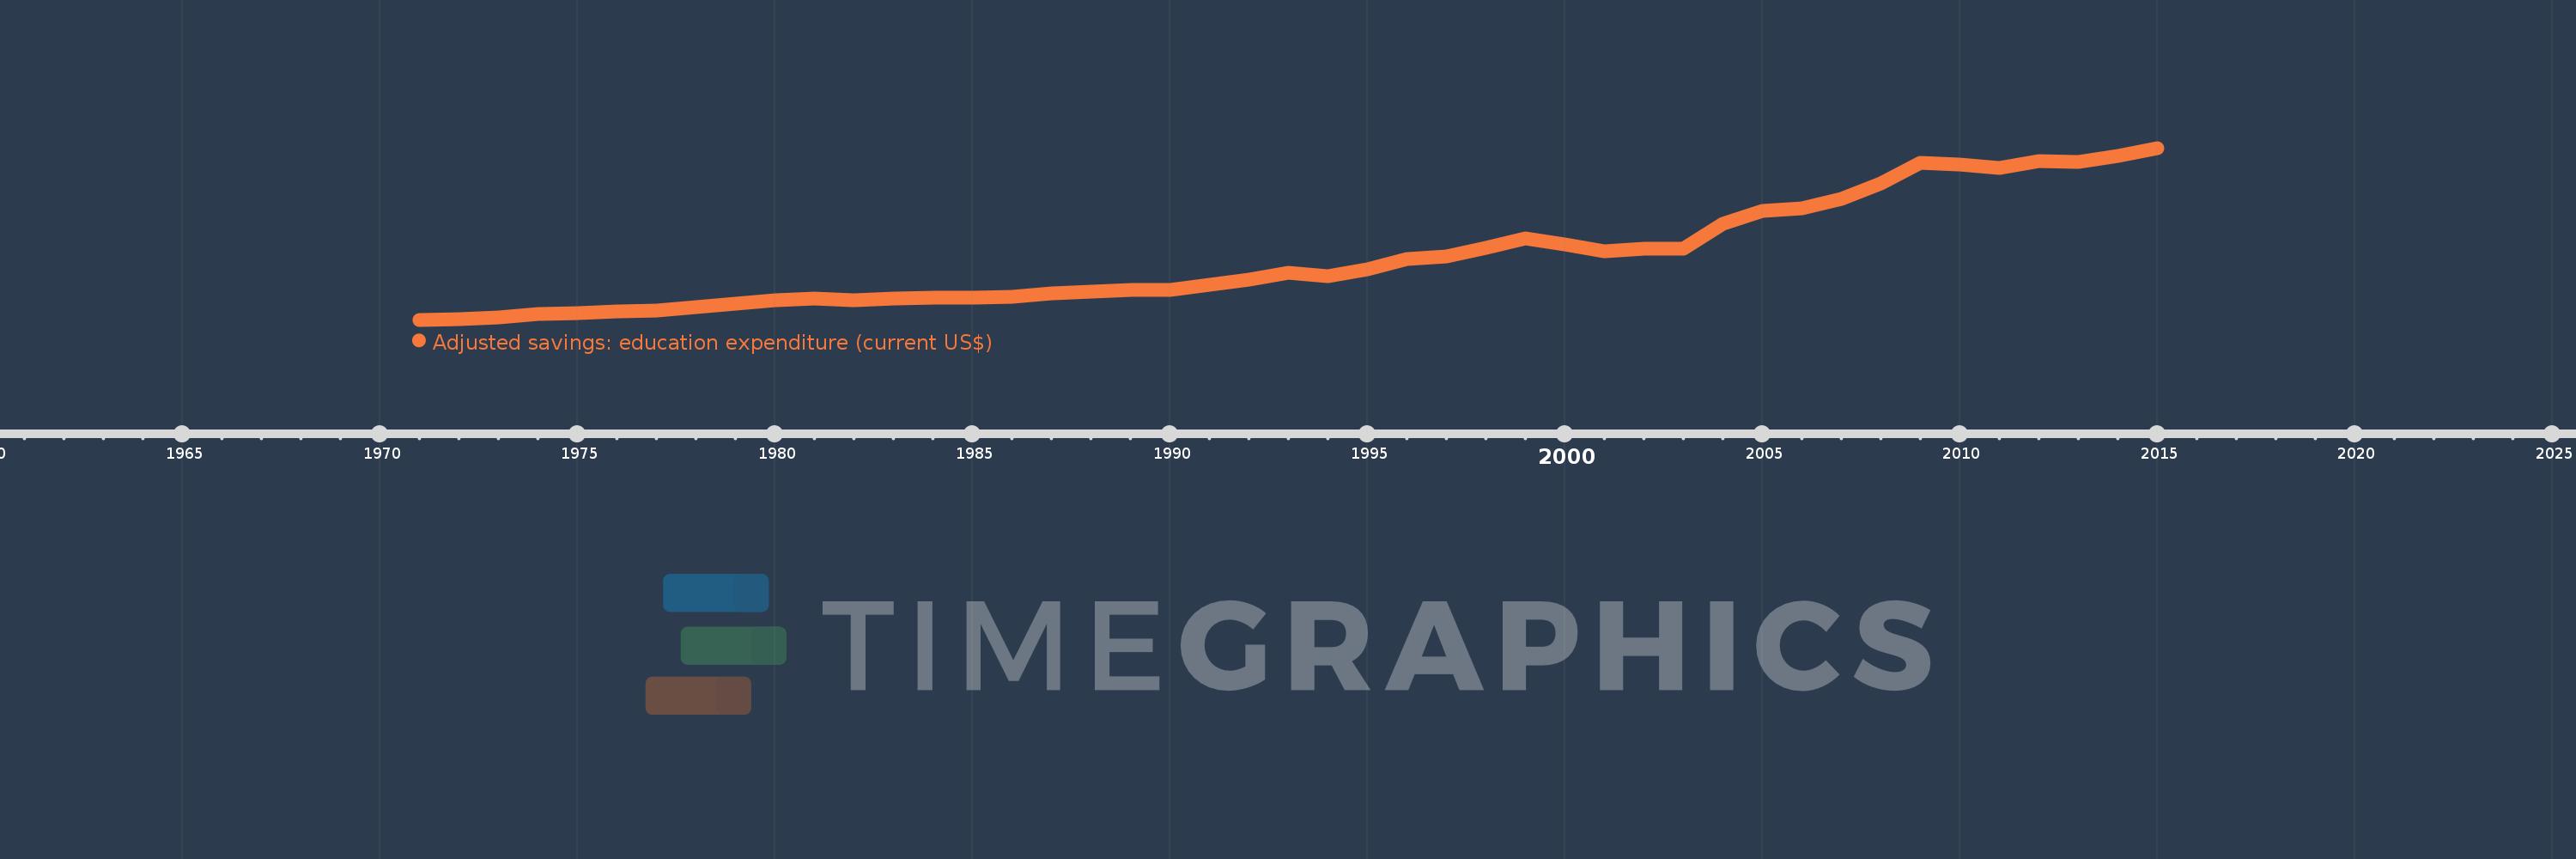
Adjusted savings: education expenditure (current US$)
2015,2014,2013,2012,2011,2010,2009,2008,2007,2006,2005,2004,2003,2002,2001,2000,1999,1998,1997,1996,1995,1994,1993,1992,1991,1990,1989,1988,1987,1986,1985,1984,1983,1982,1981,1980,1979,1978,1977,1976,1975,1974,1973,1972,1971
Cette statistique dans les autres pays:
AfghanistanAlbaniaAlgeriaAmerican SamoaAndorraAngolaAntigua and BarbudaArgentinaArmeniaAustraliaAustriaAzerbaijanBahamas, TheBahrainBangladeshBarbadosBelarusBelgiumBelizeBeninBermudaBhutanBoliviaBotswanaBrazilBrunei DarussalamBulgariaBurkina FasoBurundiCabo VerdeCambodiaCameroonCanadaCentral African RepublicChadChileChinaColombiaComorosCongo, Dem. Rep.Congo, Rep.Costa RicaCote d'IvoireCroatiaCubaCyprusCzech RepublicDenmarkDjiboutiDominicaDominican RepublicEcuadorEgypt, Arab Rep.El SalvadorEquatorial GuineaEritreaEstoniaEthiopiaFijiFinlandFranceFrench PolynesiaGabonGambia, TheGeorgiaGermanyGhanaGreeceGrenadaGuatemalaGuineaGuinea-BissauGuyanaHaitiHondurasHong Kong SAR, ChinaHungaryIcelandIndiaIndonesiaIran, Islamic Rep.IraqIrelandIsraelItalyJamaicaJapanJordanKazakhstanKenyaKiribatiKorea, Rep.KuwaitKyrgyz RepublicLao PDRLatviaLebanonLesothoLiberiaLibyaLiechtensteinLithuaniaLuxembourgMacao SAR, ChinaMacedonia, FYRMadagascarMalawiMalaysiaMaldivesMaliMaltaMarshall IslandsMauritaniaMauritiusMexicoMicronesia, Fed. Sts.MoldovaMonacoMongoliaMoroccoMozambiqueMyanmarNamibiaNepalNetherlandsNew CaledoniaNew ZealandNicaraguaNigerNigeriaNorwayOmanPakistanPanamaPapua New GuineaParaguayPeruPhilippinesPolandPortugalPuerto RicoQatarRomaniaRussian FederationRwandaSamoaSan MarinoSao Tome and PrincipeSaudi ArabiaSenegalSerbiaSeychellesSierra LeoneSingaporeSlovak RepublicSloveniaSolomon IslandsSomaliaSouth AfricaSpainSri LankaSt. Kitts and NevisSt. LuciaSt. Vincent and the GrenadinesSudanSurinameSwazilandSwedenSwitzerlandSyrian Arab RepublicTajikistanTanzaniaThailandTimor-LesteTogoTongaTrinidad and TobagoTunisiaTurkeyTurkmenistanUgandaUkraineUnited KingdomUnited StatesUruguayUzbekistanVanuatuVenezuela, RBVietnamVirgin Islands (U.S.)Yemen, Rep.ZambiaZimbabwe La ligne de temps
Cette échelle de temps montre un graphique de 1971 année à 2015 année Tunisia. Les données jusqu'à 1970 année ne sont pas présentés. Quantité d'observations actuelles selon dates: 45.
Source (désignation):
Les indicateurs du développement mondiale
Source (organisation):
World Bank staff estimates using data from the United Nations Statistics Division's Statistical Yearbook, and the UNESCO Institute for Statistics online database.
Catégories:
Economy & Growth, Environment
Dernière mise à jour
23 avr. 2017
Les indicateurs de changement de valeurs selon les années
Minimum:
63.851 mln.
1 janv. 1971
Maximum:
2.764 mds
1 janv. 2015
Pour la date d''observation
Valeur
Changement absolu
Le changement par rapport à la valeur précédente
1 janv. 1971
63.851 mln.
+63.851 mln.
0.0%
1 janv. 1972
75.341 mln.
+11.49 mln.
17.99%
1 janv. 1973
100.025 mln.
+24.684 mln.
32.76%
1 janv. 1974
148.8 mln.
+48.775 mln.
48.76%
1 janv. 1975
164.153 mln.
+15.353 mln.
10.32%
1 janv. 1976
192.887 mln.
+28.734 mln.
17.5%
1 janv. 1977
207.189 mln.
+14.301 mln.
7.41%
1 janv. 1978
265.185 mln.
+57.996 mln.
27.99%
1 janv. 1979
322.151 mln.
+56.966 mln.
21.48%
1 janv. 1980
366.89 mln.
+44.739 mln.
13.89%
1 janv. 1981
397.135 mln.
+30.245 mln.
8.24%
1 janv. 1982
373.804 mln.
-23.332 mln.
-5.87%
1 janv. 1983
391.957 mln.
+18.153 mln.
4.86%
1 janv. 1984
404.158 mln.
+12.201 mln.
3.11%
1 janv. 1985
408.017 mln.
+3.86 mln.
0.95%
1 janv. 1986
419.041 mln.
+11.024 mln.
2.7%
1 janv. 1987
481.384 mln.
+62.343 mln.
14.88%
1 janv. 1988
507.131 mln.
+25.747 mln.
5.35%
1 janv. 1989
528.486 mln.
+21.355 mln.
4.21%
1 janv. 1990
529.858 mln.
+1.371 mln.
0.26%
1 janv. 1991
617.884 mln.
+88.026 mln.
16.61%
1 janv. 1992
701.01 mln.
+83.126 mln.
13.45%
1 janv. 1993
797.581 mln.
+96.57 mln.
13.78%
1 janv. 1994
752.684 mln.
-44.897 mln.
-5.63%
1 janv. 1995
855.167 mln.
+102.483 mln.
13.62%
1 janv. 1996
1.013 mds
+158.077 mln.
18.48%
1 janv. 1997
1.057 mds
+44.084 mln.
4.35%
1 janv. 1998
1.19 mds
+133.101 mln.
12.59%
1 janv. 1999
1.338 mds
+147.486 mln.
12.39%
1 janv. 2000
1.254 mds
-83.518 mln.
-6.24%
1 janv. 2001
1.139 mds
-115.273 mln.
-9.19%
1 janv. 2002
1.182 mds
+43.152 mln.
3.79%
1 janv. 2003
1.185 mds
+2.74 mln.
0.23%
1 janv. 2004
1.574 mds
+388.928 mln.
32.82%
1 janv. 2005
1.778 mds
+204.221 mln.
12.98%
1 janv. 2006
1.82 mds
+41.611 mln.
2.34%
1 janv. 2007
1.968 mds
+148.052 mln.
8.14%
1 janv. 2008
2.207 mds
+239.149 mln.
12.15%
1 janv. 2009
2.53 mds
+323.446 mln.
14.66%
1 janv. 2010
2.499 mds
-31.667 mln.
-1.25%
1 janv. 2011
2.449 mds
-49.588 mln.
-1.98%
1 janv. 2012
2.561 mds
+112.111 mln.
4.58%
1 janv. 2013
2.541 mds
-20.46 mln.
-0.8%
1 janv. 2014
2.639 mds
+98.068 mln.
3.86%
1 janv. 2015
2.764 mds
+125.195 mln.
4.74%
Classement des pays selon les statistiques actuelles par années


Commentaires: