29
/fr/
fr
AIzaSyAYiBZKx7MnpbEhh9jyipgxe19OcubqV5w
April 1, 2024
147597
Guyana
GUY
true
2
1
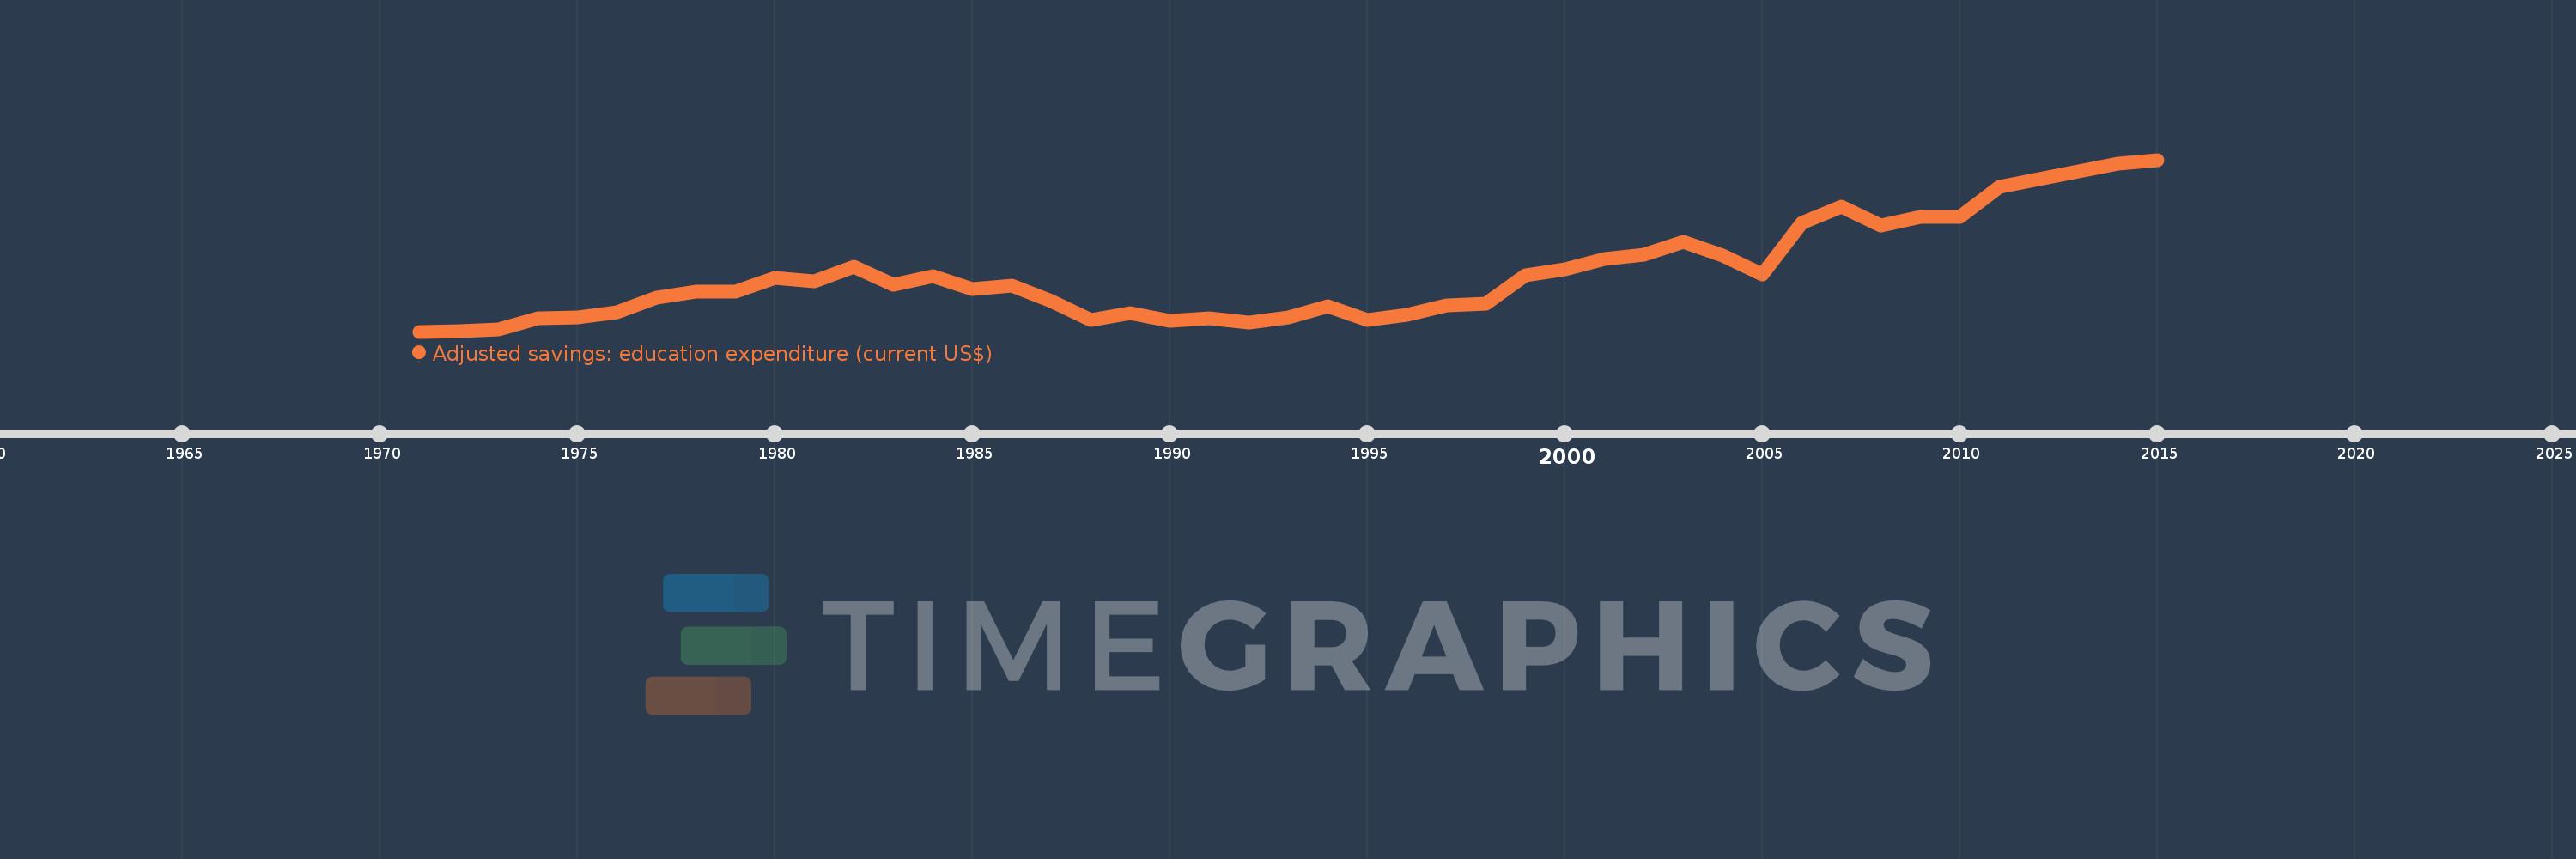
Adjusted savings: education expenditure (current US$)
2015,2014,2013,2012,2011,2010,2009,2008,2007,2006,2005,2004,2003,2002,2001,2000,1999,1998,1997,1996,1995,1994,1993,1992,1991,1990,1989,1988,1987,1986,1985,1984,1983,1982,1981,1980,1979,1978,1977,1976,1975,1974,1973,1972,1971
Cette statistique dans les autres pays:
AfghanistanAlbaniaAlgeriaAmerican SamoaAndorraAngolaAntigua and BarbudaArgentinaArmeniaAustraliaAustriaAzerbaijanBahamas, TheBahrainBangladeshBarbadosBelarusBelgiumBelizeBeninBermudaBhutanBoliviaBotswanaBrazilBrunei DarussalamBulgariaBurkina FasoBurundiCabo VerdeCambodiaCameroonCanadaCentral African RepublicChadChileChinaColombiaComorosCongo, Dem. Rep.Congo, Rep.Costa RicaCote d'IvoireCroatiaCubaCyprusCzech RepublicDenmarkDjiboutiDominicaDominican RepublicEcuadorEgypt, Arab Rep.El SalvadorEquatorial GuineaEritreaEstoniaEthiopiaFijiFinlandFranceFrench PolynesiaGabonGambia, TheGeorgiaGermanyGhanaGreeceGrenadaGuatemalaGuineaGuinea-BissauGuyanaHaitiHondurasHong Kong SAR, ChinaHungaryIcelandIndiaIndonesiaIran, Islamic Rep.IraqIrelandIsraelItalyJamaicaJapanJordanKazakhstanKenyaKiribatiKorea, Rep.KuwaitKyrgyz RepublicLao PDRLatviaLebanonLesothoLiberiaLibyaLiechtensteinLithuaniaLuxembourgMacao SAR, ChinaMacedonia, FYRMadagascarMalawiMalaysiaMaldivesMaliMaltaMarshall IslandsMauritaniaMauritiusMexicoMicronesia, Fed. Sts.MoldovaMonacoMongoliaMoroccoMozambiqueMyanmarNamibiaNepalNetherlandsNew CaledoniaNew ZealandNicaraguaNigerNigeriaNorwayOmanPakistanPanamaPapua New GuineaParaguayPeruPhilippinesPolandPortugalPuerto RicoQatarRomaniaRussian FederationRwandaSamoaSan MarinoSao Tome and PrincipeSaudi ArabiaSenegalSerbiaSeychellesSierra LeoneSingaporeSlovak RepublicSloveniaSolomon IslandsSomaliaSouth AfricaSpainSri LankaSt. Kitts and NevisSt. LuciaSt. Vincent and the GrenadinesSudanSurinameSwazilandSwedenSwitzerlandSyrian Arab RepublicTajikistanTanzaniaThailandTimor-LesteTogoTongaTrinidad and TobagoTunisiaTurkeyTurkmenistanUgandaUkraineUnited KingdomUnited StatesUruguayUzbekistanVanuatuVenezuela, RBVietnamVirgin Islands (U.S.)Yemen, Rep.ZambiaZimbabwe La ligne de temps
Cette échelle de temps montre un graphique de 1971 année à 2015 année Guyana. Les données jusqu'à 1970 année ne sont pas présentés. Quantité d'observations actuelles selon dates: 45.
Source (désignation):
Les indicateurs du développement mondiale
Source (organisation):
World Bank staff estimates using data from the United Nations Statistics Division's Statistical Yearbook, and the UNESCO Institute for Statistics online database.
Catégories:
Economy & Growth, Environment
Dernière mise à jour
23 avr. 2017
Les indicateurs de changement de valeurs selon les années
Minimum:
9.615 mln.
1 janv. 1971
Maximum:
89.523 mln.
1 janv. 2015
Pour la date d''observation
Valeur
Changement absolu
Le changement par rapport à la valeur précédente
1 janv. 1971
9.615 mln.
+9.615 mln.
0.0%
1 janv. 1972
9.77 mln.
+154.4 milles
1.61%
1 janv. 1973
10.71 mln.
+940.448 milles
9.63%
1 janv. 1974
15.765 mln.
+5.055 mln.
47.2%
1 janv. 1975
16.039 mln.
+273.95 milles
1.74%
1 janv. 1976
18.761 mln.
+2.721 mln.
16.97%
1 janv. 1977
25.199 mln.
+6.438 mln.
34.32%
1 janv. 1978
28.341 mln.
+3.142 mln.
12.47%
1 janv. 1979
28.194 mln.
-147.014 milles
-0.52%
1 janv. 1980
34.472 mln.
+6.278 mln.
22.27%
1 janv. 1981
32.879 mln.
-1.594 mln.
-4.62%
1 janv. 1982
39.613 mln.
+6.734 mln.
20.48%
1 janv. 1983
31.525 mln.
-8.088 mln.
-20.42%
1 janv. 1984
35.252 mln.
+3.727 mln.
11.82%
1 janv. 1985
29.522 mln.
-5.73 mln.
-16.25%
1 janv. 1986
31.176 mln.
+1.653 mln.
5.6%
1 janv. 1987
23.763 mln.
-7.413 mln.
-23.78%
1 janv. 1988
14.965 mln.
-8.798 mln.
-37.02%
1 janv. 1989
18.195 mln.
+3.23 mln.
21.59%
1 janv. 1990
14.613 mln.
-3.582 mln.
-19.68%
1 janv. 1991
15.688 mln.
+1.075 mln.
7.36%
1 janv. 1992
13.657 mln.
-2.032 mln.
-12.95%
1 janv. 1993
16.05 mln.
+2.393 mln.
17.52%
1 janv. 1994
21.318 mln.
+5.268 mln.
32.82%
1 janv. 1995
14.926 mln.
-6.392 mln.
-29.99%
1 janv. 1996
17.584 mln.
+2.658 mln.
17.81%
1 janv. 1997
21.739 mln.
+4.155 mln.
23.63%
1 janv. 1998
22.494 mln.
+755.84 milles
3.48%
1 janv. 1999
35.716 mln.
+13.222 mln.
58.78%
1 janv. 2000
38.638 mln.
+2.922 mln.
8.18%
1 janv. 2001
43.575 mln.
+4.937 mln.
12.78%
1 janv. 2002
45.48 mln.
+1.905 mln.
4.37%
1 janv. 2003
51.24 mln.
+5.76 mln.
12.66%
1 janv. 2004
45.031 mln.
-6.209 mln.
-12.12%
1 janv. 2005
36.153 mln.
-8.878 mln.
-19.72%
1 janv. 2006
60.349 mln.
+24.196 mln.
66.93%
1 janv. 2007
67.614 mln.
+7.266 mln.
12.04%
1 janv. 2008
59.15 mln.
-8.464 mln.
-12.52%
1 janv. 2009
63.058 mln.
+3.907 mln.
6.61%
1 janv. 2010
63.077 mln.
+19.105 milles
0.03%
1 janv. 2011
76.796 mln.
+13.719 mln.
21.75%
1 janv. 2012
80.614 mln.
+3.818 mln.
4.97%
1 janv. 2013
83.952 mln.
+3.338 mln.
4.14%
1 janv. 2014
87.911 mln.
+3.958 mln.
4.72%
1 janv. 2015
89.523 mln.
+1.612 mln.
1.83%
Classement des pays selon les statistiques actuelles par années


Commentaires: