29
/fr/
fr
AIzaSyAYiBZKx7MnpbEhh9jyipgxe19OcubqV5w
April 1, 2024
123076
Ecuador
ECU
true
2
1
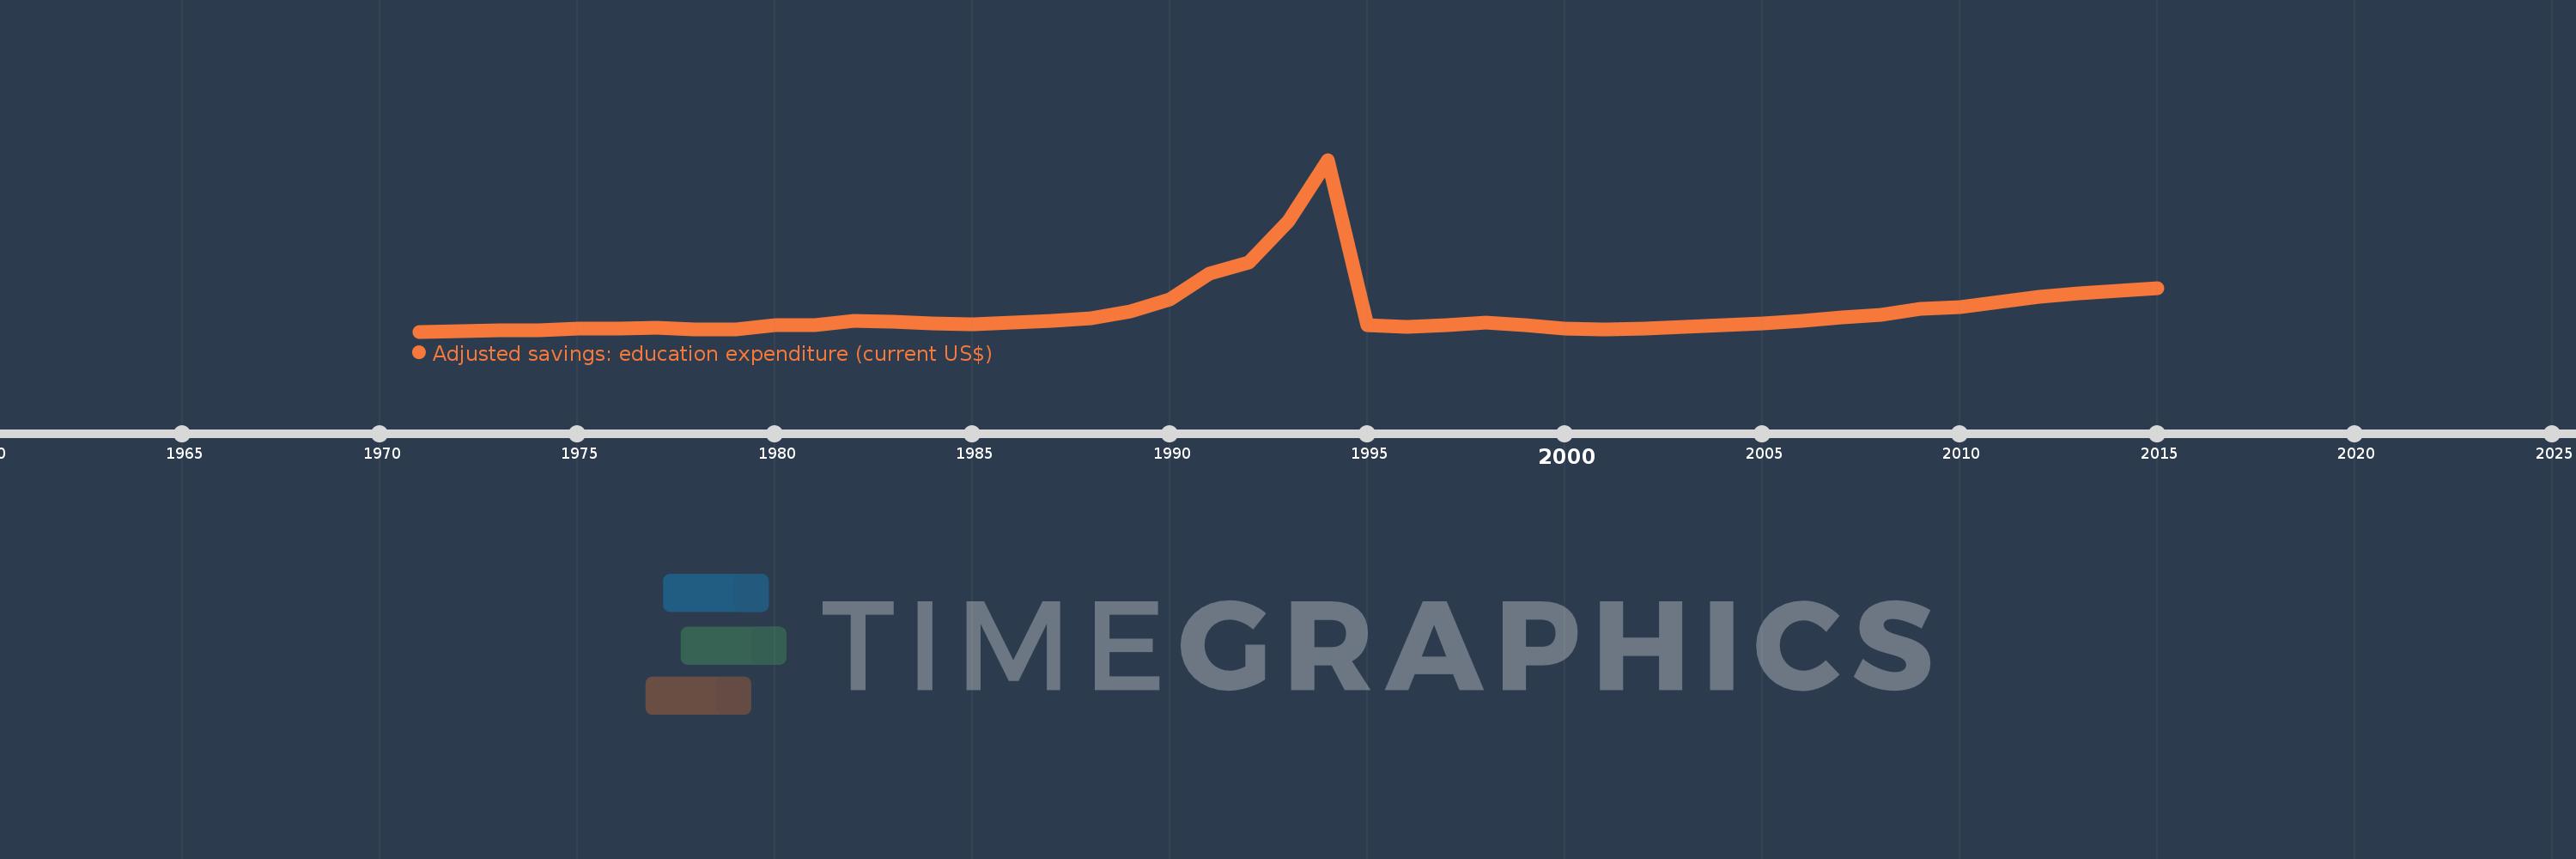
Adjusted savings: education expenditure (current US$)
2015,2014,2013,2012,2011,2010,2009,2008,2007,2006,2005,2004,2003,2002,2001,2000,1999,1998,1997,1996,1995,1994,1993,1992,1991,1990,1989,1988,1987,1986,1985,1984,1983,1982,1981,1980,1979,1978,1977,1976,1975,1974,1973,1972,1971
Cette statistique dans les autres pays:
AfghanistanAlbaniaAlgeriaAmerican SamoaAndorraAngolaAntigua and BarbudaArgentinaArmeniaAustraliaAustriaAzerbaijanBahamas, TheBahrainBangladeshBarbadosBelarusBelgiumBelizeBeninBermudaBhutanBoliviaBotswanaBrazilBrunei DarussalamBulgariaBurkina FasoBurundiCabo VerdeCambodiaCameroonCanadaCentral African RepublicChadChileChinaColombiaComorosCongo, Dem. Rep.Congo, Rep.Costa RicaCote d'IvoireCroatiaCubaCyprusCzech RepublicDenmarkDjiboutiDominicaDominican RepublicEcuadorEgypt, Arab Rep.El SalvadorEquatorial GuineaEritreaEstoniaEthiopiaFijiFinlandFranceFrench PolynesiaGabonGambia, TheGeorgiaGermanyGhanaGreeceGrenadaGuatemalaGuineaGuinea-BissauGuyanaHaitiHondurasHong Kong SAR, ChinaHungaryIcelandIndiaIndonesiaIran, Islamic Rep.IraqIrelandIsraelItalyJamaicaJapanJordanKazakhstanKenyaKiribatiKorea, Rep.KuwaitKyrgyz RepublicLao PDRLatviaLebanonLesothoLiberiaLibyaLiechtensteinLithuaniaLuxembourgMacao SAR, ChinaMacedonia, FYRMadagascarMalawiMalaysiaMaldivesMaliMaltaMarshall IslandsMauritaniaMauritiusMexicoMicronesia, Fed. Sts.MoldovaMonacoMongoliaMoroccoMozambiqueMyanmarNamibiaNepalNetherlandsNew CaledoniaNew ZealandNicaraguaNigerNigeriaNorwayOmanPakistanPanamaPapua New GuineaParaguayPeruPhilippinesPolandPortugalPuerto RicoQatarRomaniaRussian FederationRwandaSamoaSan MarinoSao Tome and PrincipeSaudi ArabiaSenegalSerbiaSeychellesSierra LeoneSingaporeSlovak RepublicSloveniaSolomon IslandsSomaliaSouth AfricaSpainSri LankaSt. Kitts and NevisSt. LuciaSt. Vincent and the GrenadinesSudanSurinameSwazilandSwedenSwitzerlandSyrian Arab RepublicTajikistanTanzaniaThailandTimor-LesteTogoTongaTrinidad and TobagoTunisiaTurkeyTurkmenistanUgandaUkraineUnited KingdomUnited StatesUruguayUzbekistanVanuatuVenezuela, RBVietnamVirgin Islands (U.S.)Yemen, Rep.ZambiaZimbabwe La ligne de temps
Cette échelle de temps montre un graphique de 1971 année à 2015 année Ecuador. Les données jusqu'à 1970 année ne sont pas présentés. Quantité d'observations actuelles selon dates: 45.
Source (désignation):
Les indicateurs du développement mondiale
Source (organisation):
World Bank staff estimates using data from the United Nations Statistics Division's Statistical Yearbook, and the UNESCO Institute for Statistics online database.
Catégories:
Economy & Growth, Environment
Dernière mise à jour
23 avr. 2017
Les indicateurs de changement de valeurs selon les années
Minimum:
45.333 mln.
1 janv. 1971
Maximum:
15.18 mds
1 janv. 1994
Pour la date d''observation
Valeur
Changement absolu
Le changement par rapport à la valeur précédente
1 janv. 1971
45.333 mln.
+45.333 mln.
0.0%
1 janv. 1972
46.215 mln.
+881.911 milles
1.95%
1 janv. 1973
134.362 mln.
+88.147 mln.
190.73%
1 janv. 1974
161.524 mln.
+27.162 mln.
20.22%
1 janv. 1975
275.163 mln.
+113.64 mln.
70.35%
1 janv. 1976
328.393 mln.
+53.23 mln.
19.34%
1 janv. 1977
384.633 mln.
+56.239 mln.
17.13%
1 janv. 1978
228.503 mln.
-156.13 mln.
-40.59%
1 janv. 1979
246.089 mln.
+17.586 mln.
7.7%
1 janv. 1980
591.971 mln.
+345.882 mln.
140.55%
1 janv. 1981
576.104 mln.
-15.866 mln.
-2.68%
1 janv. 1982
973.884 mln.
+397.78 mln.
69.05%
1 janv. 1983
878.657 mln.
-95.227 mln.
-9.78%
1 janv. 1984
755.472 mln.
-123.185 mln.
-14.02%
1 janv. 1985
690.223 mln.
-65.249 mln.
-8.64%
1 janv. 1986
836.659 mln.
+146.435 mln.
21.22%
1 janv. 1987
959.016 mln.
+122.357 mln.
14.62%
1 janv. 1988
1.252 mds
+293.442 mln.
30.6%
1 janv. 1989
1.824 mds
+571.867 mln.
45.66%
1 janv. 1990
2.871 mds
+1.046 mds
57.35%
1 janv. 1991
5.134 mds
+2.263 mds
78.84%
1 janv. 1992
6.143 mds
+1.009 mds
19.65%
1 janv. 1993
9.743 mds
+3.6 mds
58.61%
1 janv. 1994
15.18 mds
+5.437 mds
55.81%
1 janv. 1995
602.219 mln.
-14.578 mds
-96.03%
1 janv. 1996
470.168 mln.
-132.051 mln.
-21.93%
1 janv. 1997
629.278 mln.
+159.109 mln.
33.84%
1 janv. 1998
860.813 mln.
+231.536 mln.
36.79%
1 janv. 1999
643.459 mln.
-217.354 mln.
-25.25%
1 janv. 2000
282.404 mln.
-361.056 mln.
-56.11%
1 janv. 2001
199.614 mln.
-82.79 mln.
-29.32%
1 janv. 2002
335.434 mln.
+135.819 mln.
68.04%
1 janv. 2003
469.507 mln.
+134.074 mln.
39.97%
1 janv. 2004
615.719 mln.
+146.211 mln.
31.14%
1 janv. 2005
785.395 mln.
+169.676 mln.
27.56%
1 janv. 2006
1.004 mds
+218.817 mln.
27.86%
1 janv. 2007
1.259 mds
+255.048 mln.
25.4%
1 janv. 2008
1.506 mds
+246.259 mln.
19.56%
1 janv. 2009
2.015 mds
+509.543 mln.
33.85%
1 janv. 2010
2.211 mds
+195.903 mln.
9.72%
1 janv. 2011
2.658 mds
+447.4 mln.
20.24%
1 janv. 2012
3.121 mds
+462.332 mln.
17.39%
1 janv. 2013
3.404 mds
+283.502 mln.
9.08%
1 janv. 2014
3.67 mds
+265.749 mln.
7.81%
1 janv. 2015
3.904 mds
+234.305 mln.
6.38%
Classement des pays selon les statistiques actuelles par années


Commentaires: