29
/fr/
fr
AIzaSyAYiBZKx7MnpbEhh9jyipgxe19OcubqV5w
April 1, 2024
132849
Finland
FIN
true
2
1
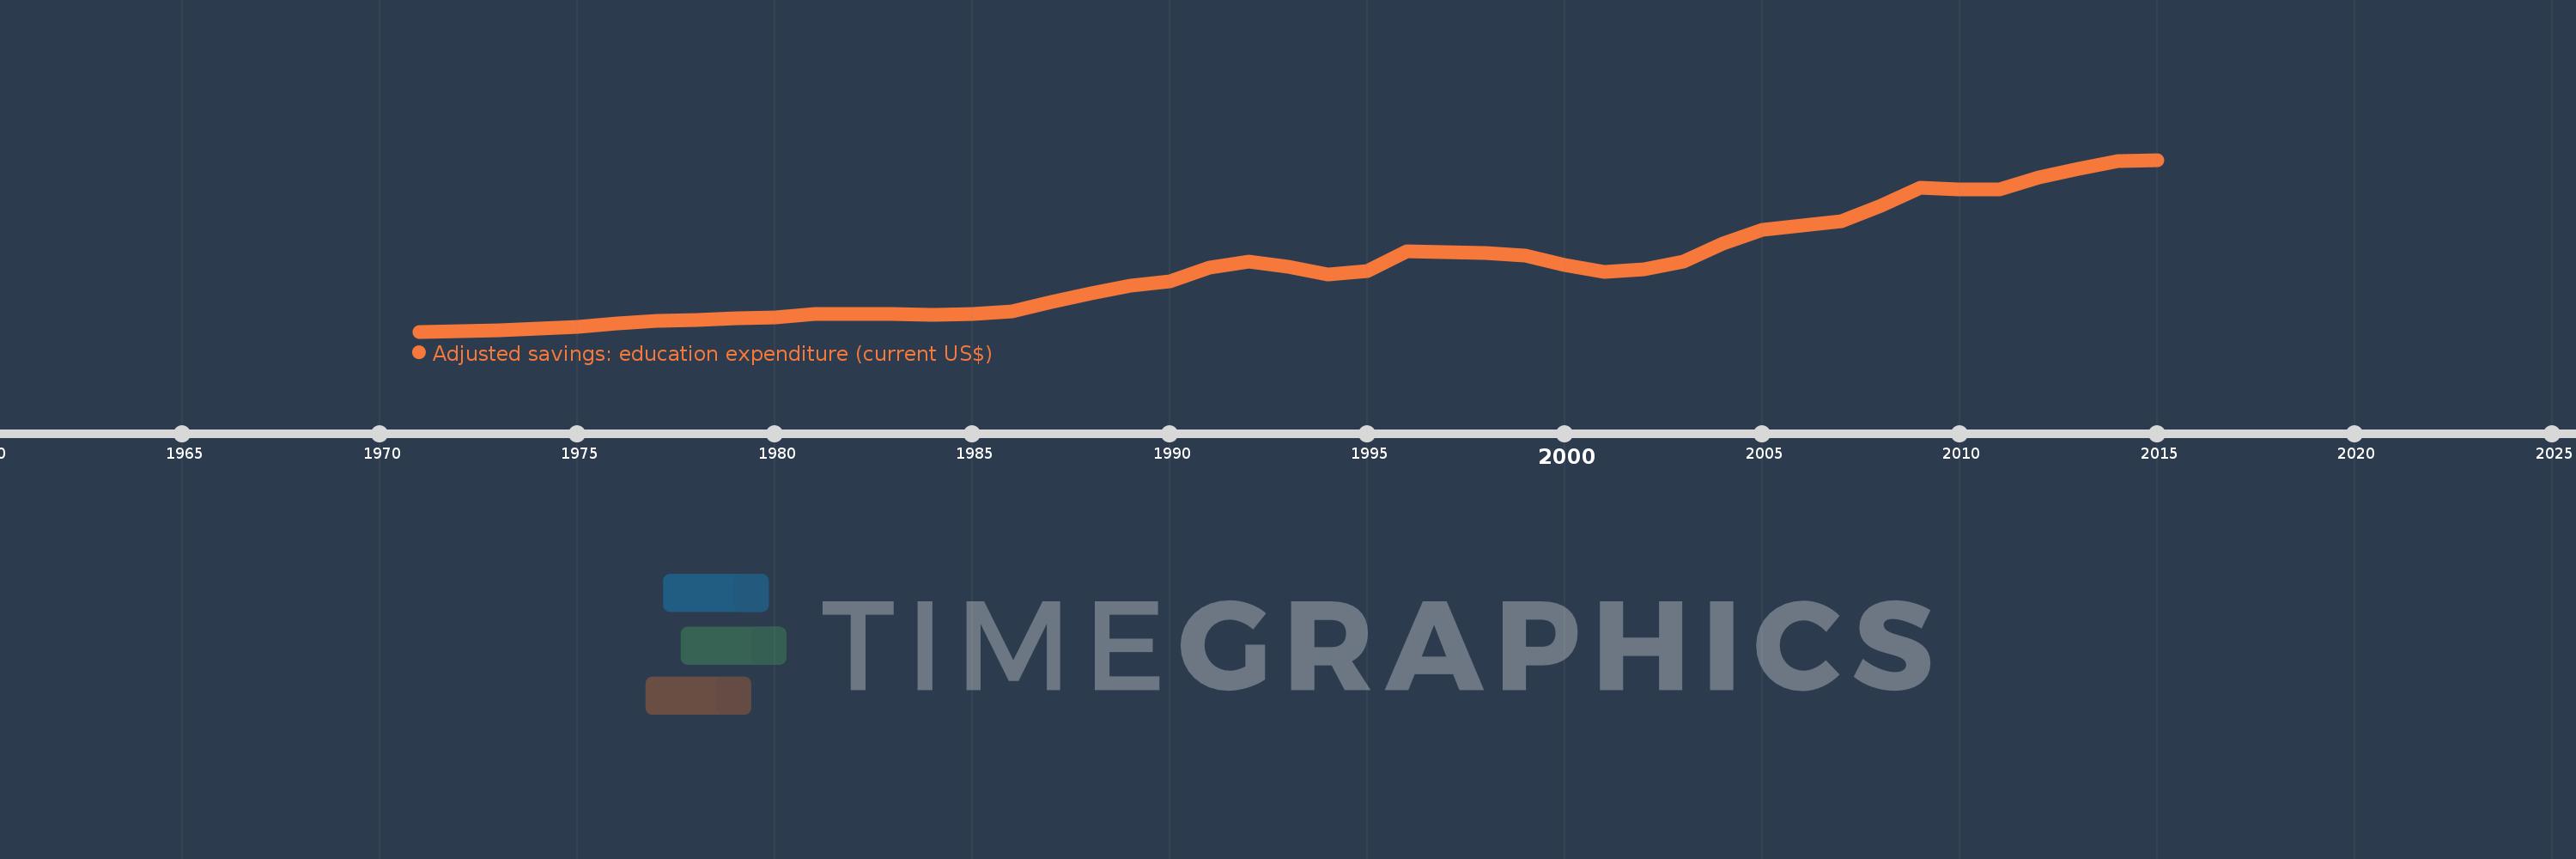
Adjusted savings: education expenditure (current US$)
2015,2014,2013,2012,2011,2010,2009,2008,2007,2006,2005,2004,2003,2002,2001,2000,1999,1998,1997,1996,1995,1994,1993,1992,1991,1990,1989,1988,1987,1986,1985,1984,1983,1982,1981,1980,1979,1978,1977,1976,1975,1974,1973,1972,1971
Cette statistique dans les autres pays:
AfghanistanAlbaniaAlgeriaAmerican SamoaAndorraAngolaAntigua and BarbudaArgentinaArmeniaAustraliaAustriaAzerbaijanBahamas, TheBahrainBangladeshBarbadosBelarusBelgiumBelizeBeninBermudaBhutanBoliviaBotswanaBrazilBrunei DarussalamBulgariaBurkina FasoBurundiCabo VerdeCambodiaCameroonCanadaCentral African RepublicChadChileChinaColombiaComorosCongo, Dem. Rep.Congo, Rep.Costa RicaCote d'IvoireCroatiaCubaCyprusCzech RepublicDenmarkDjiboutiDominicaDominican RepublicEcuadorEgypt, Arab Rep.El SalvadorEquatorial GuineaEritreaEstoniaEthiopiaFijiFinlandFranceFrench PolynesiaGabonGambia, TheGeorgiaGermanyGhanaGreeceGrenadaGuatemalaGuineaGuinea-BissauGuyanaHaitiHondurasHong Kong SAR, ChinaHungaryIcelandIndiaIndonesiaIran, Islamic Rep.IraqIrelandIsraelItalyJamaicaJapanJordanKazakhstanKenyaKiribatiKorea, Rep.KuwaitKyrgyz RepublicLao PDRLatviaLebanonLesothoLiberiaLibyaLiechtensteinLithuaniaLuxembourgMacao SAR, ChinaMacedonia, FYRMadagascarMalawiMalaysiaMaldivesMaliMaltaMarshall IslandsMauritaniaMauritiusMexicoMicronesia, Fed. Sts.MoldovaMonacoMongoliaMoroccoMozambiqueMyanmarNamibiaNepalNetherlandsNew CaledoniaNew ZealandNicaraguaNigerNigeriaNorwayOmanPakistanPanamaPapua New GuineaParaguayPeruPhilippinesPolandPortugalPuerto RicoQatarRomaniaRussian FederationRwandaSamoaSan MarinoSao Tome and PrincipeSaudi ArabiaSenegalSerbiaSeychellesSierra LeoneSingaporeSlovak RepublicSloveniaSolomon IslandsSomaliaSouth AfricaSpainSri LankaSt. Kitts and NevisSt. LuciaSt. Vincent and the GrenadinesSudanSurinameSwazilandSwedenSwitzerlandSyrian Arab RepublicTajikistanTanzaniaThailandTimor-LesteTogoTongaTrinidad and TobagoTunisiaTurkeyTurkmenistanUgandaUkraineUnited KingdomUnited StatesUruguayUzbekistanVanuatuVenezuela, RBVietnamVirgin Islands (U.S.)Yemen, Rep.ZambiaZimbabwe La ligne de temps
Cette échelle de temps montre un graphique de 1971 année à 2015 année Finland. Les données jusqu'à 1970 année ne sont pas présentés. Quantité d'observations actuelles selon dates: 45.
Source (désignation):
Les indicateurs du développement mondiale
Source (organisation):
World Bank staff estimates using data from the United Nations Statistics Division's Statistical Yearbook, and the UNESCO Institute for Statistics online database.
Catégories:
Economy & Growth, Environment
Dernière mise à jour
23 avr. 2017
Les indicateurs de changement de valeurs selon les années
Minimum:
561.981 mln.
1 janv. 1971
Maximum:
18.354 mds
1 janv. 2015
Pour la date d''observation
Valeur
Changement absolu
Le changement par rapport à la valeur précédente
1 janv. 1971
561.981 mln.
+561.981 mln.
0.0%
1 janv. 1972
619.569 mln.
+57.587 mln.
10.25%
1 janv. 1973
668.91 mln.
+49.342 mln.
7.96%
1 janv. 1974
883.187 mln.
+214.276 mln.
32.03%
1 janv. 1975
1.077 mds
+193.691 mln.
21.93%
1 janv. 1976
1.451 mds
+374.486 mln.
34.78%
1 janv. 1977
1.631 mds
+179.525 mln.
12.37%
1 janv. 1978
1.776 mds
+144.956 mln.
8.89%
1 janv. 1979
1.923 mds
+146.907 mln.
8.27%
1 janv. 1980
2.008 mds
+84.829 mln.
4.41%
1 janv. 1981
2.422 mds
+414.115 mln.
20.63%
1 janv. 1982
2.406 mds
-15.612 mln.
-0.64%
1 janv. 1983
2.364 mds
-41.598 mln.
-1.73%
1 janv. 1984
2.329 mds
-35.209 mln.
-1.49%
1 janv. 1985
2.365 mds
+36.21 mln.
1.55%
1 janv. 1986
2.669 mds
+303.214 mln.
12.82%
1 janv. 1987
3.595 mds
+925.881 mln.
34.69%
1 janv. 1988
4.564 mds
+969.908 mln.
26.98%
1 janv. 1989
5.335 mds
+770.922 mln.
16.89%
1 janv. 1990
5.756 mds
+420.812 mln.
7.89%
1 janv. 1991
7.229 mds
+1.473 mds
25.58%
1 janv. 1992
7.829 mds
+600.545 mln.
8.31%
1 janv. 1993
7.236 mds
-593.459 mln.
-7.58%
1 janv. 1994
6.464 mds
-772.115 mln.
-10.67%
1 janv. 1995
6.846 mds
+381.862 mln.
5.91%
1 janv. 1996
8.859 mds
+2.013 mds
29.41%
1 janv. 1997
8.78 mds
-78.676 mln.
-0.89%
1 janv. 1998
8.703 mds
-76.905 mln.
-0.88%
1 janv. 1999
8.453 mds
-250.147 mln.
-2.87%
1 janv. 2000
7.43 mds
-1.023 mds
-12.1%
1 janv. 2001
6.737 mds
-692.964 mln.
-9.33%
1 janv. 2002
7.041 mds
+304.359 mln.
4.52%
1 janv. 2003
7.768 mds
+726.989 mln.
10.32%
1 janv. 2004
9.643 mds
+1.875 mds
24.13%
1 janv. 2005
11.136 mds
+1.493 mds
15.49%
1 janv. 2006
11.537 mds
+401.268 mln.
3.6%
1 janv. 2007
11.957 mds
+419.463 mln.
3.64%
1 janv. 2008
13.578 mds
+1.621 mds
13.56%
1 janv. 2009
15.464 mds
+1.886 mds
13.89%
1 janv. 2010
15.309 mds
-155.539 mln.
-1.01%
1 janv. 2011
15.246 mds
-62.772 mln.
-0.41%
1 janv. 2012
16.549 mds
+1.303 mds
8.54%
1 janv. 2013
17.418 mds
+869.373 mln.
5.25%
1 janv. 2014
18.234 mds
+816.075 mln.
4.69%
1 janv. 2015
18.354 mds
+120.15 mln.
0.66%
Classement des pays selon les statistiques actuelles par années


Commentaires: