29
/fr/
fr
AIzaSyAYiBZKx7MnpbEhh9jyipgxe19OcubqV5w
April 1, 2024
113192
Cote d'Ivoire
CIV
true
2
1
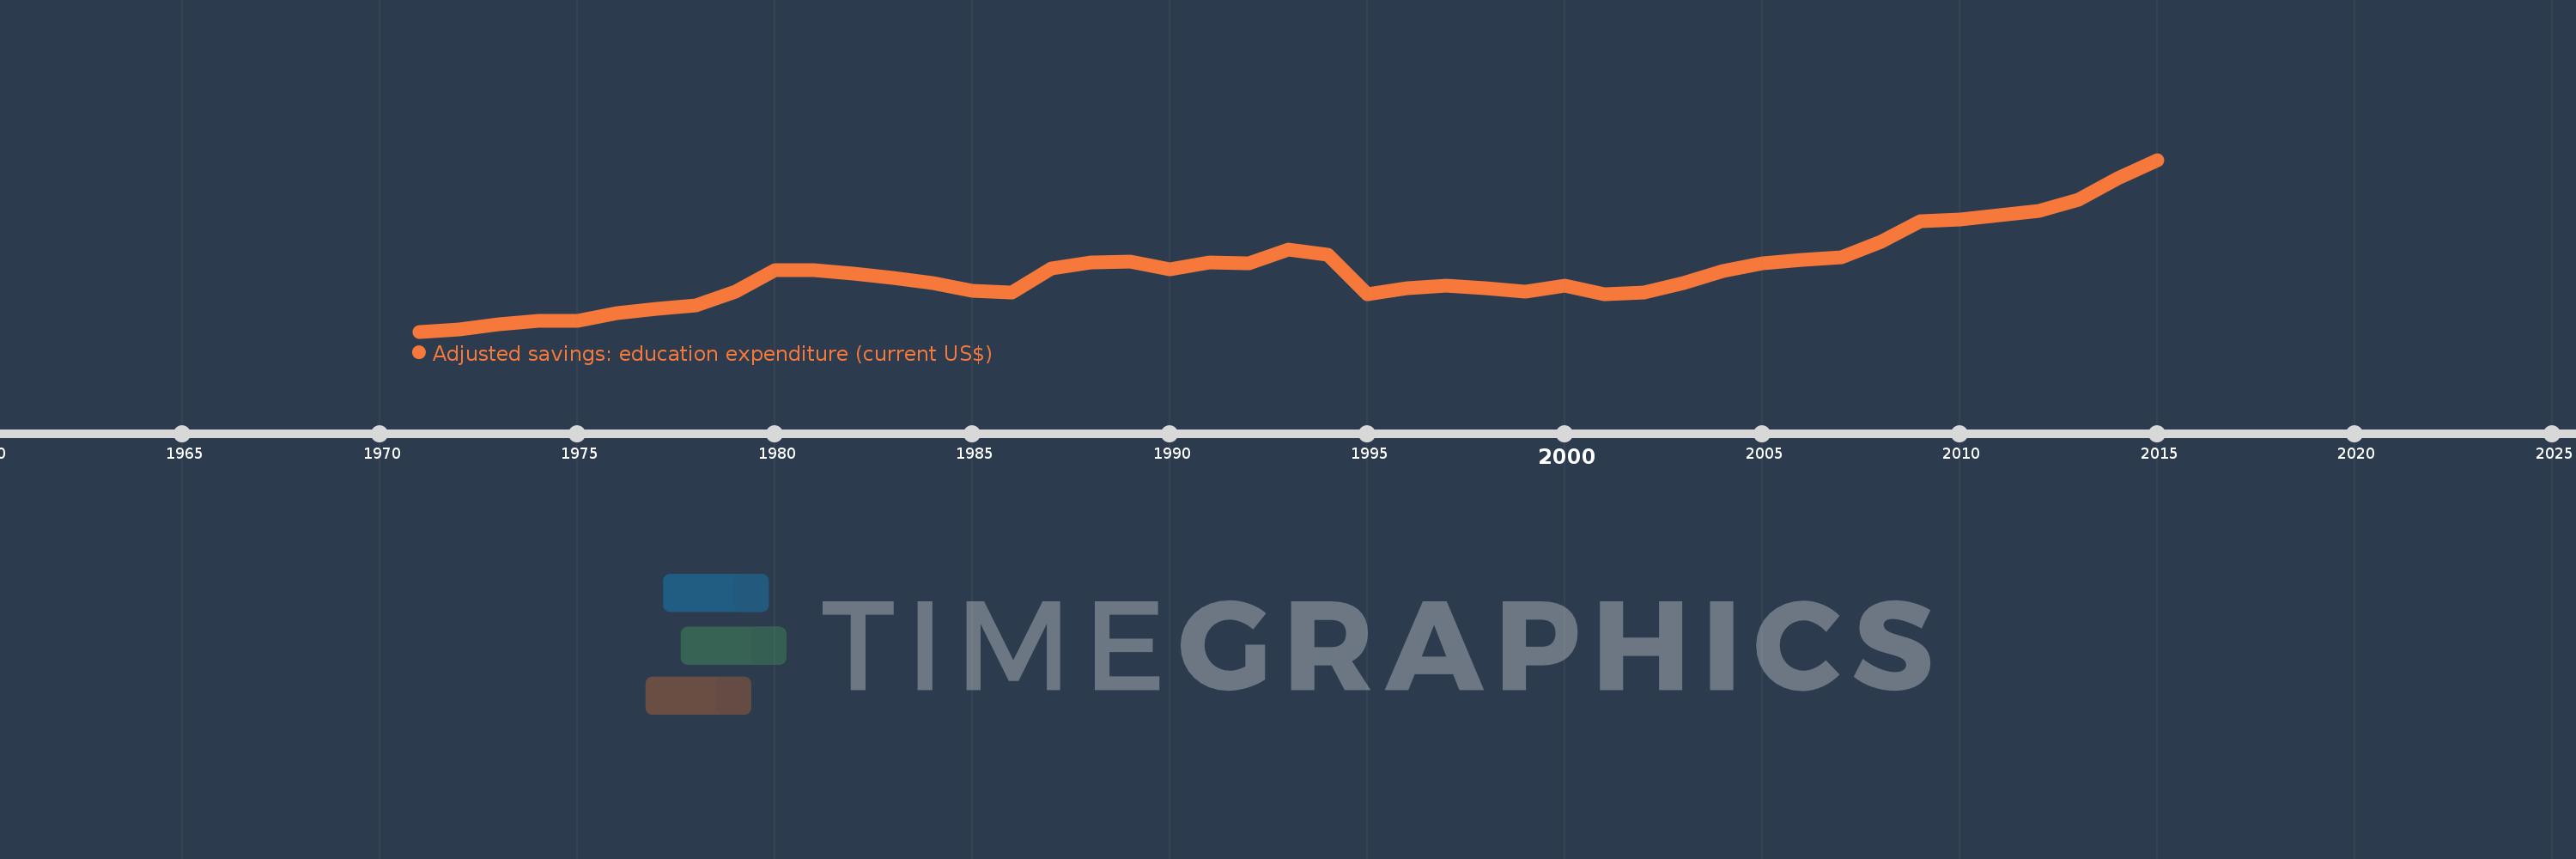
Adjusted savings: education expenditure (current US$)
2015,2014,2013,2012,2011,2010,2009,2008,2007,2006,2005,2004,2003,2002,2001,2000,1999,1998,1997,1996,1995,1994,1993,1992,1991,1990,1989,1988,1987,1986,1985,1984,1983,1982,1981,1980,1979,1978,1977,1976,1975,1974,1973,1972,1971
Cette statistique dans les autres pays:
AfghanistanAlbaniaAlgeriaAmerican SamoaAndorraAngolaAntigua and BarbudaArgentinaArmeniaAustraliaAustriaAzerbaijanBahamas, TheBahrainBangladeshBarbadosBelarusBelgiumBelizeBeninBermudaBhutanBoliviaBotswanaBrazilBrunei DarussalamBulgariaBurkina FasoBurundiCabo VerdeCambodiaCameroonCanadaCentral African RepublicChadChileChinaColombiaComorosCongo, Dem. Rep.Congo, Rep.Costa RicaCote d'IvoireCroatiaCubaCyprusCzech RepublicDenmarkDjiboutiDominicaDominican RepublicEcuadorEgypt, Arab Rep.El SalvadorEquatorial GuineaEritreaEstoniaEthiopiaFijiFinlandFranceFrench PolynesiaGabonGambia, TheGeorgiaGermanyGhanaGreeceGrenadaGuatemalaGuineaGuinea-BissauGuyanaHaitiHondurasHong Kong SAR, ChinaHungaryIcelandIndiaIndonesiaIran, Islamic Rep.IraqIrelandIsraelItalyJamaicaJapanJordanKazakhstanKenyaKiribatiKorea, Rep.KuwaitKyrgyz RepublicLao PDRLatviaLebanonLesothoLiberiaLibyaLiechtensteinLithuaniaLuxembourgMacao SAR, ChinaMacedonia, FYRMadagascarMalawiMalaysiaMaldivesMaliMaltaMarshall IslandsMauritaniaMauritiusMexicoMicronesia, Fed. Sts.MoldovaMonacoMongoliaMoroccoMozambiqueMyanmarNamibiaNepalNetherlandsNew CaledoniaNew ZealandNicaraguaNigerNigeriaNorwayOmanPakistanPanamaPapua New GuineaParaguayPeruPhilippinesPolandPortugalPuerto RicoQatarRomaniaRussian FederationRwandaSamoaSan MarinoSao Tome and PrincipeSaudi ArabiaSenegalSerbiaSeychellesSierra LeoneSingaporeSlovak RepublicSloveniaSolomon IslandsSomaliaSouth AfricaSpainSri LankaSt. Kitts and NevisSt. LuciaSt. Vincent and the GrenadinesSudanSurinameSwazilandSwedenSwitzerlandSyrian Arab RepublicTajikistanTanzaniaThailandTimor-LesteTogoTongaTrinidad and TobagoTunisiaTurkeyTurkmenistanUgandaUkraineUnited KingdomUnited StatesUruguayUzbekistanVanuatuVenezuela, RBVietnamVirgin Islands (U.S.)Yemen, Rep.ZambiaZimbabwe La ligne de temps
Cette échelle de temps montre un graphique de 1971 année à 2015 année Cote d'Ivoire. Les données jusqu'à 1970 année ne sont pas présentés. Quantité d'observations actuelles selon dates: 45.
Source (désignation):
Les indicateurs du développement mondiale
Source (organisation):
World Bank staff estimates using data from the United Nations Statistics Division's Statistical Yearbook, and the UNESCO Institute for Statistics online database.
Catégories:
Economy & Growth, Environment
Dernière mise à jour
23 avr. 2017
Les indicateurs de changement de valeurs selon les années
Minimum:
68.141 mln.
1 janv. 1971
Maximum:
1.502 mds
1 janv. 2015
Pour la date d''observation
Valeur
Changement absolu
Le changement par rapport à la valeur précédente
1 janv. 1971
68.141 mln.
+68.141 mln.
0.0%
1 janv. 1972
86.606 mln.
+18.464 mln.
27.1%
1 janv. 1973
130.633 mln.
+44.028 mln.
50.84%
1 janv. 1974
156.333 mln.
+25.699 mln.
19.67%
1 janv. 1975
160.567 mln.
+4.234 mln.
2.71%
1 janv. 1976
225.176 mln.
+64.61 mln.
40.24%
1 janv. 1977
261.224 mln.
+36.047 mln.
16.01%
1 janv. 1978
285.331 mln.
+24.107 mln.
9.23%
1 janv. 1979
402.361 mln.
+117.03 mln.
41.02%
1 janv. 1980
581.737 mln.
+179.376 mln.
44.58%
1 janv. 1981
580.831 mln.
-905.705 milles
-0.16%
1 janv. 1982
553.721 mln.
-27.111 mln.
-4.67%
1 janv. 1983
512.942 mln.
-40.778 mln.
-7.36%
1 janv. 1984
473.559 mln.
-39.383 mln.
-7.68%
1 janv. 1985
406.374 mln.
-67.184 mln.
-14.19%
1 janv. 1986
396.626 mln.
-9.749 mln.
-2.4%
1 janv. 1987
592.515 mln.
+195.889 mln.
49.39%
1 janv. 1988
643.482 mln.
+50.967 mln.
8.6%
1 janv. 1989
650.89 mln.
+7.409 mln.
1.15%
1 janv. 1990
585.821 mln.
-65.07 mln.
-10.0%
1 janv. 1991
644.362 mln.
+58.541 mln.
9.99%
1 janv. 1992
638.23 mln.
-6.132 mln.
-0.95%
1 janv. 1993
755.159 mln.
+116.929 mln.
18.32%
1 janv. 1994
706.571 mln.
-48.588 mln.
-6.43%
1 janv. 1995
376.971 mln.
-329.6 mln.
-46.65%
1 janv. 1996
430.545 mln.
+53.573 mln.
14.21%
1 janv. 1997
448.931 mln.
+18.387 mln.
4.27%
1 janv. 1998
429.109 mln.
-19.822 mln.
-4.42%
1 janv. 1999
399.047 mln.
-30.062 mln.
-7.01%
1 janv. 2000
452.09 mln.
+53.043 mln.
13.29%
1 janv. 2001
382.774 mln.
-69.316 mln.
-15.33%
1 janv. 2002
392.506 mln.
+9.732 mln.
2.54%
1 janv. 2003
476.574 mln.
+84.069 mln.
21.42%
1 janv. 2004
576.687 mln.
+100.113 mln.
21.01%
1 janv. 2005
637.766 mln.
+61.079 mln.
10.59%
1 janv. 2006
667.174 mln.
+29.408 mln.
4.61%
1 janv. 2007
690.488 mln.
+23.314 mln.
3.49%
1 janv. 2008
818.532 mln.
+128.045 mln.
18.54%
1 janv. 2009
989.734 mln.
+171.202 mln.
20.92%
1 janv. 2010
1.003 mds
+13.005 mln.
1.31%
1 janv. 2011
1.042 mds
+39.709 mln.
3.96%
1 janv. 2012
1.074 mds
+31.206 mln.
2.99%
1 janv. 2013
1.166 mds
+92.394 mln.
8.61%
1 janv. 2014
1.347 mds
+180.761 mln.
15.5%
1 janv. 2015
1.502 mds
+154.801 mln.
11.49%
Classement des pays selon les statistiques actuelles par années


Commentaires: