29
/fr/
fr
AIzaSyAYiBZKx7MnpbEhh9jyipgxe19OcubqV5w
April 1, 2024
116589
Cyprus
CYP
true
2
1
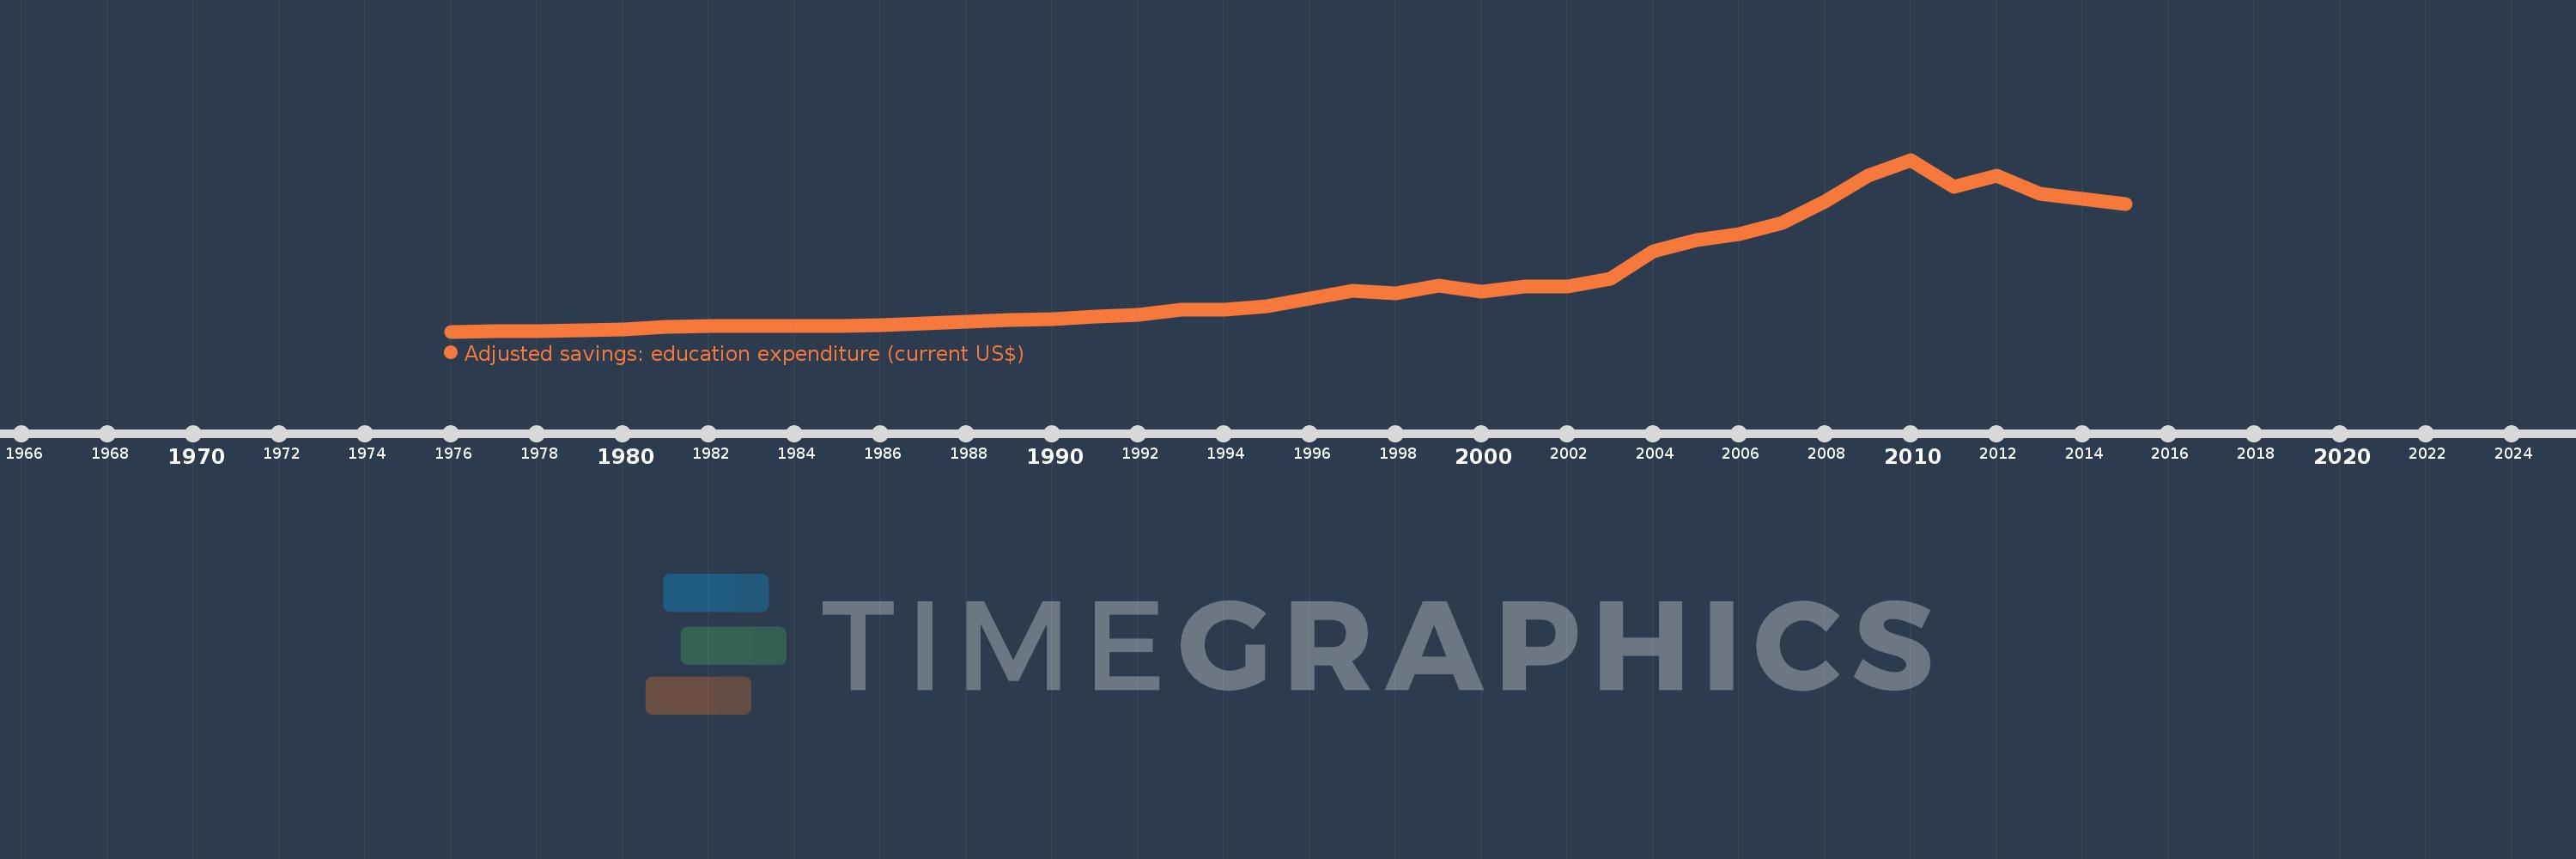
Adjusted savings: education expenditure (current US$)
2015,2014,2013,2012,2011,2010,2009,2008,2007,2006,2005,2004,2003,2002,2001,2000,1999,1998,1997,1996,1995,1994,1993,1992,1991,1990,1989,1988,1987,1986,1985,1984,1983,1982,1981,1980,1979,1978,1977,1976
Cette statistique dans les autres pays:
AfghanistanAlbaniaAlgeriaAmerican SamoaAndorraAngolaAntigua and BarbudaArgentinaArmeniaAustraliaAustriaAzerbaijanBahamas, TheBahrainBangladeshBarbadosBelarusBelgiumBelizeBeninBermudaBhutanBoliviaBotswanaBrazilBrunei DarussalamBulgariaBurkina FasoBurundiCabo VerdeCambodiaCameroonCanadaCentral African RepublicChadChileChinaColombiaComorosCongo, Dem. Rep.Congo, Rep.Costa RicaCote d'IvoireCroatiaCubaCyprusCzech RepublicDenmarkDjiboutiDominicaDominican RepublicEcuadorEgypt, Arab Rep.El SalvadorEquatorial GuineaEritreaEstoniaEthiopiaFijiFinlandFranceFrench PolynesiaGabonGambia, TheGeorgiaGermanyGhanaGreeceGrenadaGuatemalaGuineaGuinea-BissauGuyanaHaitiHondurasHong Kong SAR, ChinaHungaryIcelandIndiaIndonesiaIran, Islamic Rep.IraqIrelandIsraelItalyJamaicaJapanJordanKazakhstanKenyaKiribatiKorea, Rep.KuwaitKyrgyz RepublicLao PDRLatviaLebanonLesothoLiberiaLibyaLiechtensteinLithuaniaLuxembourgMacao SAR, ChinaMacedonia, FYRMadagascarMalawiMalaysiaMaldivesMaliMaltaMarshall IslandsMauritaniaMauritiusMexicoMicronesia, Fed. Sts.MoldovaMonacoMongoliaMoroccoMozambiqueMyanmarNamibiaNepalNetherlandsNew CaledoniaNew ZealandNicaraguaNigerNigeriaNorwayOmanPakistanPanamaPapua New GuineaParaguayPeruPhilippinesPolandPortugalPuerto RicoQatarRomaniaRussian FederationRwandaSamoaSan MarinoSao Tome and PrincipeSaudi ArabiaSenegalSerbiaSeychellesSierra LeoneSingaporeSlovak RepublicSloveniaSolomon IslandsSomaliaSouth AfricaSpainSri LankaSt. Kitts and NevisSt. LuciaSt. Vincent and the GrenadinesSudanSurinameSwazilandSwedenSwitzerlandSyrian Arab RepublicTajikistanTanzaniaThailandTimor-LesteTogoTongaTrinidad and TobagoTunisiaTurkeyTurkmenistanUgandaUkraineUnited KingdomUnited StatesUruguayUzbekistanVanuatuVenezuela, RBVietnamVirgin Islands (U.S.)Yemen, Rep.ZambiaZimbabwe La ligne de temps
Cette échelle de temps montre un graphique de 1976 année à 2015 année Cyprus. Les données jusqu'à 1975 année ne sont pas présentés. Quantité d'observations actuelles selon dates: 40.
Source (désignation):
Les indicateurs du développement mondiale
Source (organisation):
World Bank staff estimates using data from the United Nations Statistics Division's Statistical Yearbook, and the UNESCO Institute for Statistics online database.
Catégories:
Economy & Growth, Environment
Dernière mise à jour
23 avr. 2017
Les indicateurs de changement de valeurs selon les années
Minimum:
19.255 mln.
1 janv. 1976
Maximum:
1.79 mds
1 janv. 2010
Pour la date d''observation
Valeur
Changement absolu
Le changement par rapport à la valeur précédente
1 janv. 1976
19.255 mln.
+19.255 mln.
0.0%
1 janv. 1977
19.722 mln.
+466.704 milles
2.42%
1 janv. 1978
21.74 mln.
+2.018 mln.
10.23%
1 janv. 1979
28.481 mln.
+6.742 mln.
31.01%
1 janv. 1980
39.177 mln.
+10.696 mln.
37.55%
1 janv. 1981
70.026 mln.
+30.849 mln.
78.74%
1 janv. 1982
74.03 mln.
+4.004 mln.
5.72%
1 janv. 1983
76.473 mln.
+2.443 mln.
3.3%
1 janv. 1984
77.753 mln.
+1.28 mln.
1.67%
1 janv. 1985
77.605 mln.
-147.319 milles
-0.19%
1 janv. 1986
82.913 mln.
+5.307 mln.
6.84%
1 janv. 1987
102.173 mln.
+19.26 mln.
23.23%
1 janv. 1988
123.914 mln.
+21.741 mln.
21.28%
1 janv. 1989
138.726 mln.
+14.812 mln.
11.95%
1 janv. 1990
148.322 mln.
+9.596 mln.
6.92%
1 janv. 1991
176.146 mln.
+27.824 mln.
18.76%
1 janv. 1992
193.606 mln.
+17.46 mln.
9.91%
1 janv. 1993
244.958 mln.
+51.352 mln.
26.52%
1 janv. 1994
247.363 mln.
+2.405 mln.
0.98%
1 janv. 1995
277.859 mln.
+30.496 mln.
12.33%
1 janv. 1996
357.693 mln.
+79.834 mln.
28.73%
1 janv. 1997
440.728 mln.
+83.035 mln.
23.21%
1 janv. 1998
416.433 mln.
-24.295 mln.
-5.51%
1 janv. 1999
489.082 mln.
+72.65 mln.
17.45%
1 janv. 2000
432.018 mln.
-57.064 mln.
-11.67%
1 janv. 2001
487.547 mln.
+55.529 mln.
12.85%
1 janv. 2002
482.22 mln.
-5.327 mln.
-1.09%
1 janv. 2003
563.653 mln.
+81.432 mln.
16.89%
1 janv. 2004
847.759 mln.
+284.107 mln.
50.4%
1 janv. 2005
961.684 mln.
+113.924 mln.
13.44%
1 janv. 2006
1.023 mds
+61.434 mln.
6.39%
1 janv. 2007
1.137 mds
+113.402 mln.
11.08%
1 janv. 2008
1.36 mds
+223.144 mln.
19.63%
1 janv. 2009
1.626 mds
+266.234 mln.
19.58%
1 janv. 2010
1.79 mds
+163.956 mln.
10.08%
1 janv. 2011
1.512 mds
-278.257 mln.
-15.55%
1 janv. 2012
1.63 mds
+117.93 mln.
7.8%
1 janv. 2013
1.441 mds
-188.962 mln.
-11.6%
1 janv. 2014
1.385 mds
-55.376 mln.
-3.84%
1 janv. 2015
1.332 mds
-53.652 mln.
-3.87%
Classement des pays selon les statistiques actuelles par années


Commentaires: