29
/fr/
fr
AIzaSyAYiBZKx7MnpbEhh9jyipgxe19OcubqV5w
April 1, 2024
266494
Trinidad and Tobago
TTO
true
2
1
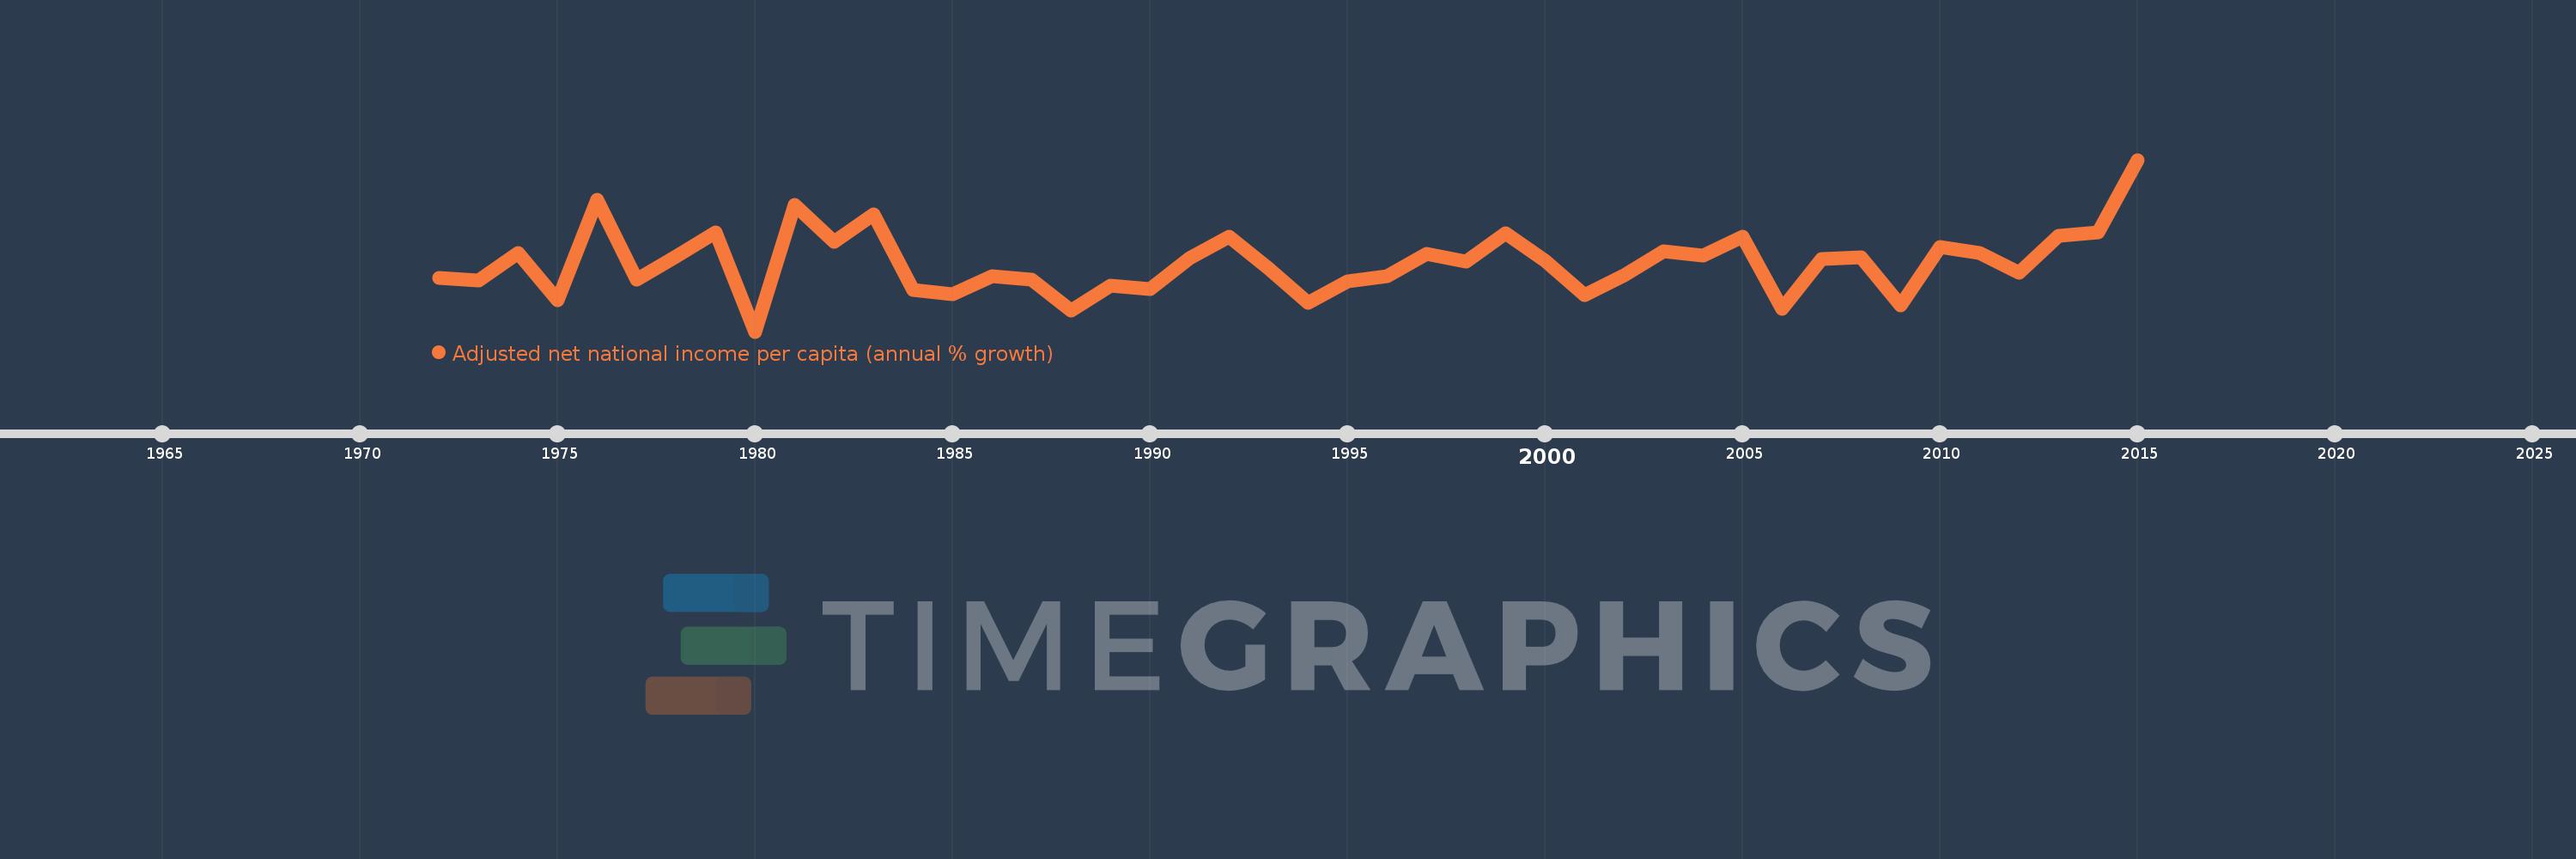
Adjusted net national income per capita (annual % growth)
2015,2014,2013,2012,2011,2010,2009,2008,2007,2006,2005,2004,2003,2002,2001,2000,1999,1998,1997,1996,1995,1994,1993,1992,1991,1990,1989,1988,1987,1986,1985,1984,1983,1982,1981,1980,1979,1978,1977,1976,1975,1974,1973,1972
Cette statistique dans les autres pays:
La ligne de temps
Cette échelle de temps montre un graphique de 1972 année à 2015 année Trinidad and Tobago. Les données jusqu'à 1971 année ne sont pas présentés. Quantité d'observations actuelles selon dates: 44.
Source (désignation):
Les indicateurs du développement mondiale
Source (organisation):
World Bank staff estimates based on sources and methods in World Bank's "The Changing Wealth of Nations: Measuring Sustainable Development in the New Millennium" (2011).
Catégories:
Economy & Growth
Dernière mise à jour
23 avr. 2017
Les indicateurs de changement de valeurs selon les années
Minimum:
-24.542
1 janv. 1980
Maximum:
45.327
1 janv. 2015
Pour la date d''observation
Valeur
Changement absolu
Le changement par rapport à la valeur précédente
1 janv. 1972
-2.674
-2.674
0.0%
1 janv. 1973
-3.621
-0.947
35.42%
1 janv. 1974
7.596
+11.217
-309.77%
1 janv. 1975
-11.643
-19.239
-253.29%
1 janv. 1976
29.166
+40.809
-350.49%
1 janv. 1977
-3.24
-32.406
-111.11%
1 janv. 1978
6.153
+9.392
-289.9%
1 janv. 1979
15.649
+9.496
154.35%
1 janv. 1980
-24.542
-40.191
-256.83%
1 janv. 1981
26.868
+51.41
-209.47%
1 janv. 1982
11.938
-14.93
-55.57%
1 janv. 1983
23.268
+11.33
94.91%
1 janv. 1984
-7.654
-30.922
-132.89%
1 janv. 1985
-9.304
-1.651
21.57%
1 janv. 1986
-1.84
+7.464
-80.22%
1 janv. 1987
-3.577
-1.737
94.37%
1 janv. 1988
-16.01
-12.434
347.65%
1 janv. 1989
-6.01
+10.0
-62.46%
1 janv. 1990
-7.111
-1.101
18.31%
1 janv. 1991
5.471
+12.582
-176.95%
1 janv. 1992
13.989
+8.518
155.68%
1 janv. 1993
1.272
-12.717
-90.91%
1 janv. 1994
-12.798
-14.07
-1.11 milles%
1 janv. 1995
-3.934
+8.864
-69.26%
1 janv. 1996
-1.867
+2.067
-52.55%
1 janv. 1997
6.927
+8.793
-471.1%
1 janv. 1998
3.903
-3.023
-43.65%
1 janv. 1999
15.594
+11.69
299.5%
1 janv. 2000
4.219
-11.375
-72.95%
1 janv. 2001
-9.802
-14.02
-332.33%
1 janv. 2002
-1.557
+8.245
-84.12%
1 janv. 2003
8.261
+9.818
-630.64%
1 janv. 2004
6.421
-1.84
-22.27%
1 janv. 2005
14.054
+7.633
118.87%
1 janv. 2006
-15.224
-29.278
-208.32%
1 janv. 2007
4.979
+20.203
-132.7%
1 janv. 2008
5.723
+0.744
14.95%
1 janv. 2009
-13.738
-19.461
-340.04%
1 janv. 2010
9.879
+23.616
-171.91%
1 janv. 2011
7.418
-2.461
-24.91%
1 janv. 2012
-0.534
-7.952
-107.2%
1 janv. 2013
14.52
+15.054
-2.82 milles%
1 janv. 2014
15.8
+1.28
8.82%
1 janv. 2015
45.327
+29.527
186.87%
Classement des pays selon les statistiques actuelles par années


Commentaires: