29
/fr/
fr
AIzaSyAYiBZKx7MnpbEhh9jyipgxe19OcubqV5w
April 1, 2024
206338
Nepal
NPL
true
2
1
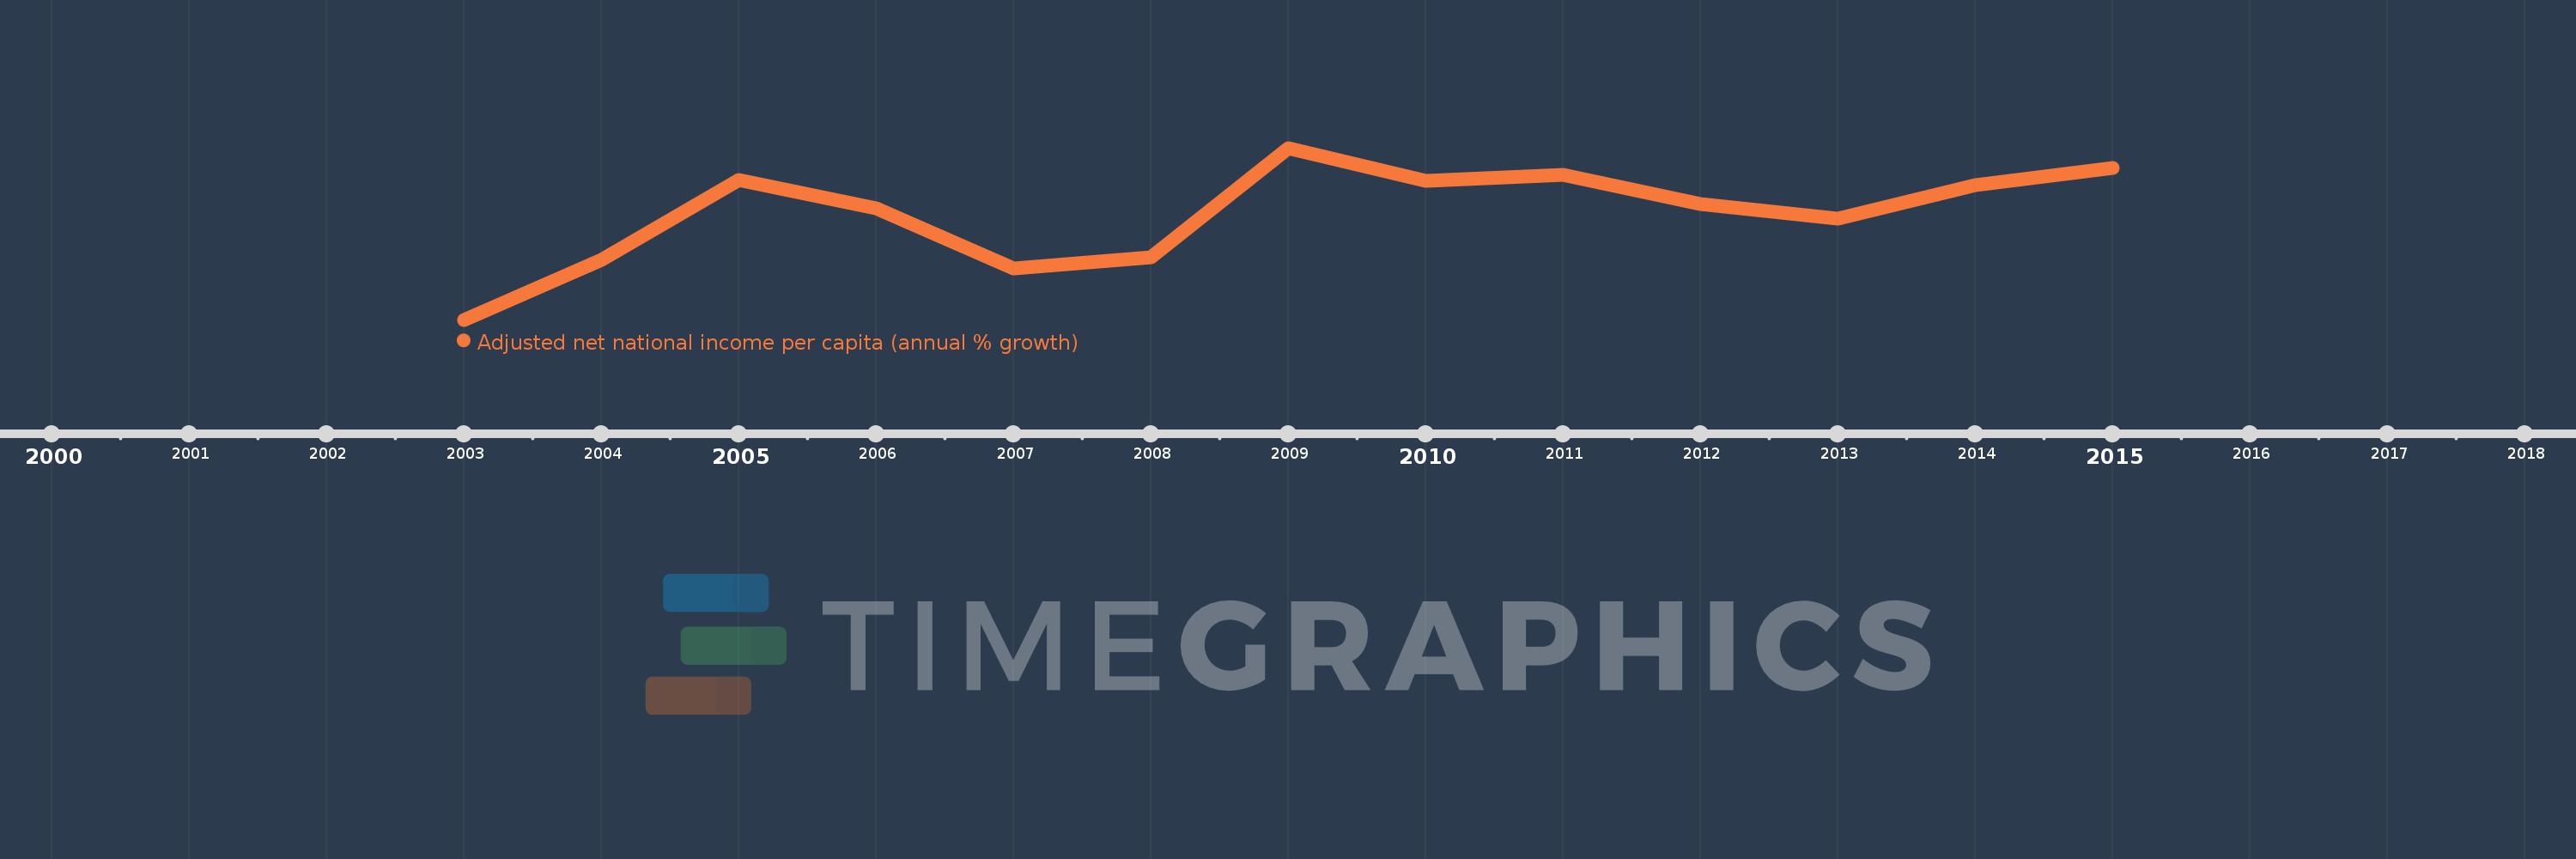
Adjusted net national income per capita (annual % growth)
2015,2014,2013,2012,2011,2010,2009,2008,2007,2006,2005,2004,2003
Cette statistique dans les autres pays:
La ligne de temps
Cette échelle de temps montre un graphique de 2003 année à 2015 année Nepal. Les données jusqu'à 2002 année ne sont pas présentés. Quantité d'observations actuelles selon dates: 13.
Source (désignation):
Les indicateurs du développement mondiale
Source (organisation):
World Bank staff estimates based on sources and methods in World Bank's "The Changing Wealth of Nations: Measuring Sustainable Development in the New Millennium" (2011).
Catégories:
Economy & Growth
Dernière mise à jour
23 avr. 2017
Les indicateurs de changement de valeurs selon les années
Minimum:
-2.696
1 janv. 2003
Maximum:
6.372
1 janv. 2009
Pour la date d''observation
Valeur
Changement absolu
Le changement par rapport à la valeur précédente
1 janv. 2003
-2.696
-2.696
0.0%
1 janv. 2004
0.478
+3.175
-117.73%
1 janv. 2005
4.675
+4.196
877.56%
1 janv. 2006
3.167
-1.507
-32.24%
1 janv. 2007
0.027
-3.141
-99.16%
1 janv. 2008
0.613
+0.587
2.2 milles%
1 janv. 2009
6.372
+5.759
938.84%
1 janv. 2010
4.654
-1.718
-26.97%
1 janv. 2011
4.955
+0.301
6.47%
1 janv. 2012
3.413
-1.541
-31.11%
1 janv. 2013
2.618
-0.796
-23.31%
1 janv. 2014
4.428
+1.81
69.15%
1 janv. 2015
5.32
+0.892
20.13%
Classement des pays selon les statistiques actuelles par années


Commentaires: