29
/fr/
fr
AIzaSyAYiBZKx7MnpbEhh9jyipgxe19OcubqV5w
April 1, 2024
248260
Sri Lanka
LKA
true
2
1
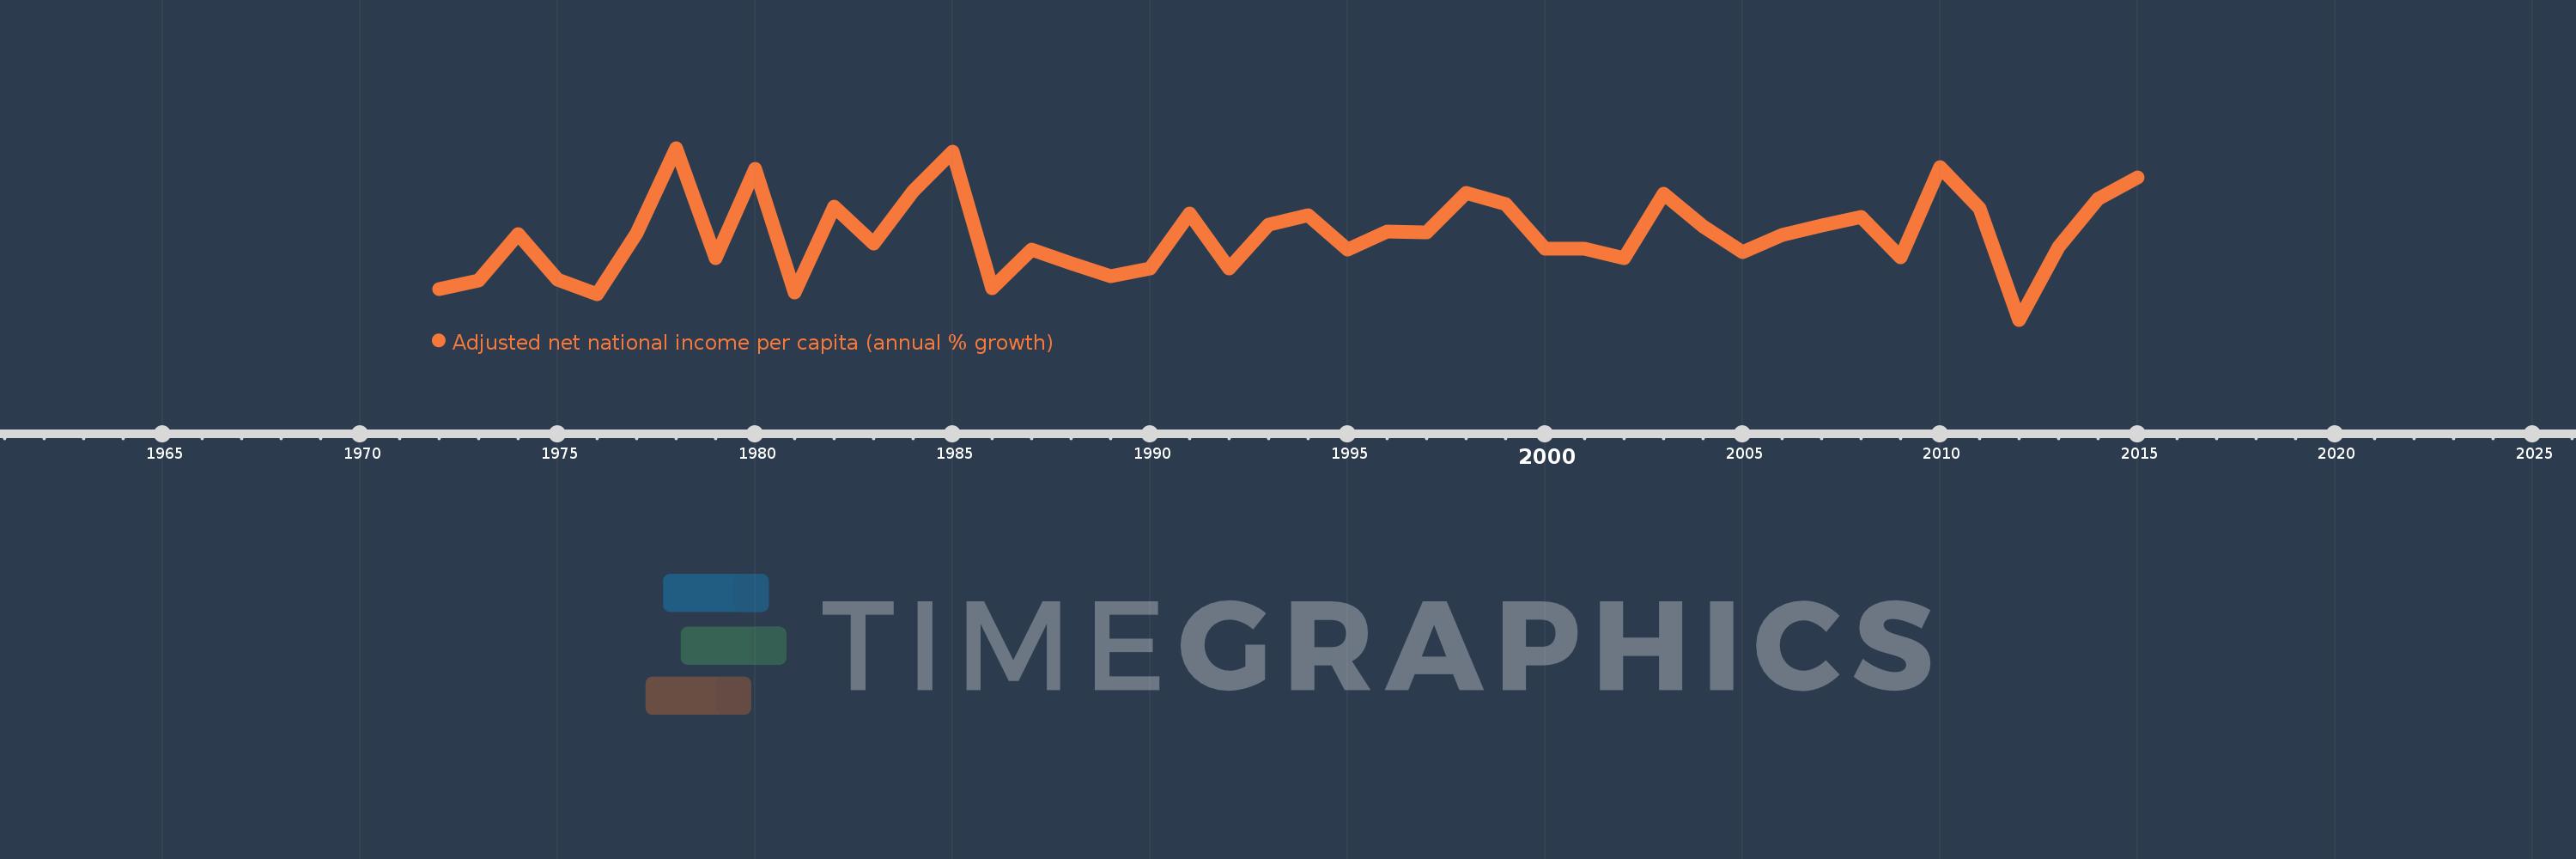
Adjusted net national income per capita (annual % growth)
2015,2014,2013,2012,2011,2010,2009,2008,2007,2006,2005,2004,2003,2002,2001,2000,1999,1998,1997,1996,1995,1994,1993,1992,1991,1990,1989,1988,1987,1986,1985,1984,1983,1982,1981,1980,1979,1978,1977,1976,1975,1974,1973,1972
Cette statistique dans les autres pays:
La ligne de temps
Cette échelle de temps montre un graphique de 1972 année à 2015 année Sri Lanka. Les données jusqu'à 1971 année ne sont pas présentés. Quantité d'observations actuelles selon dates: 44.
Source (désignation):
Les indicateurs du développement mondiale
Source (organisation):
World Bank staff estimates based on sources and methods in World Bank's "The Changing Wealth of Nations: Measuring Sustainable Development in the New Millennium" (2011).
Catégories:
Economy & Growth
Dernière mise à jour
23 avr. 2017
Les indicateurs de changement de valeurs selon les années
Minimum:
-5.443
1 janv. 2012
Maximum:
13.441
1 janv. 1978
Pour la date d''observation
Valeur
Changement absolu
Le changement par rapport à la valeur précédente
1 janv. 1972
-2.114
-2.114
0.0%
1 janv. 1973
-1.116
+0.997
-47.18%
1 janv. 1974
3.959
+5.076
-454.62%
1 janv. 1975
-1.032
-4.991
-126.06%
1 janv. 1976
-2.682
-1.65
159.96%
1 janv. 1977
4.112
+6.793
-253.32%
1 janv. 1978
13.441
+9.33
226.92%
1 janv. 1979
1.298
-12.143
-90.34%
1 janv. 1980
11.128
+9.83
757.31%
1 janv. 1981
-2.49
-13.618
-122.38%
1 janv. 1982
6.99
+9.48
-380.68%
1 janv. 1983
2.966
-4.024
-57.57%
1 janv. 1984
8.669
+5.703
192.26%
1 janv. 1985
13.078
+4.41
50.87%
1 janv. 1986
-1.934
-15.012
-114.79%
1 janv. 1987
2.29
+4.224
-218.42%
1 janv. 1988
0.792
-1.498
-65.4%
1 janv. 1989
-0.653
-1.446
-182.44%
1 janv. 1990
0.167
+0.82
-125.59%
1 janv. 1991
6.197
+6.03
3.61 milles%
1 janv. 1992
0.158
-6.038
-97.44%
1 janv. 1993
5.041
+4.883
3.08 milles%
1 janv. 1994
6.04
+0.999
19.81%
1 janv. 1995
2.281
-3.759
-62.23%
1 janv. 1996
4.272
+1.991
87.26%
1 janv. 1997
4.161
-0.111
-2.6%
1 janv. 1998
8.48
+4.32
103.81%
1 janv. 1999
7.317
-1.163
-13.72%
1 janv. 2000
2.386
-4.931
-67.39%
1 janv. 2001
2.403
+0.016
0.68%
1 janv. 2002
1.28
-1.122
-46.71%
1 janv. 2003
8.402
+7.122
556.21%
1 janv. 2004
4.799
-3.604
-42.89%
1 janv. 2005
1.978
-2.82
-58.78%
1 janv. 2006
3.853
+1.875
94.8%
1 janv. 2007
4.877
+1.023
26.56%
1 janv. 2008
5.84
+0.964
19.76%
1 janv. 2009
1.413
-4.428
-75.81%
1 janv. 2010
11.358
+9.945
704.07%
1 janv. 2011
6.832
-4.526
-39.85%
1 janv. 2012
-5.443
-12.275
-179.67%
1 janv. 2013
2.513
+7.956
-146.17%
1 janv. 2014
7.881
+5.368
213.6%
1 janv. 2015
10.232
+2.351
29.83%
Classement des pays selon les statistiques actuelles par années


Commentaires: