29
/fr/
fr
AIzaSyAYiBZKx7MnpbEhh9jyipgxe19OcubqV5w
April 1, 2024
264168
Togo
TGO
true
2
1
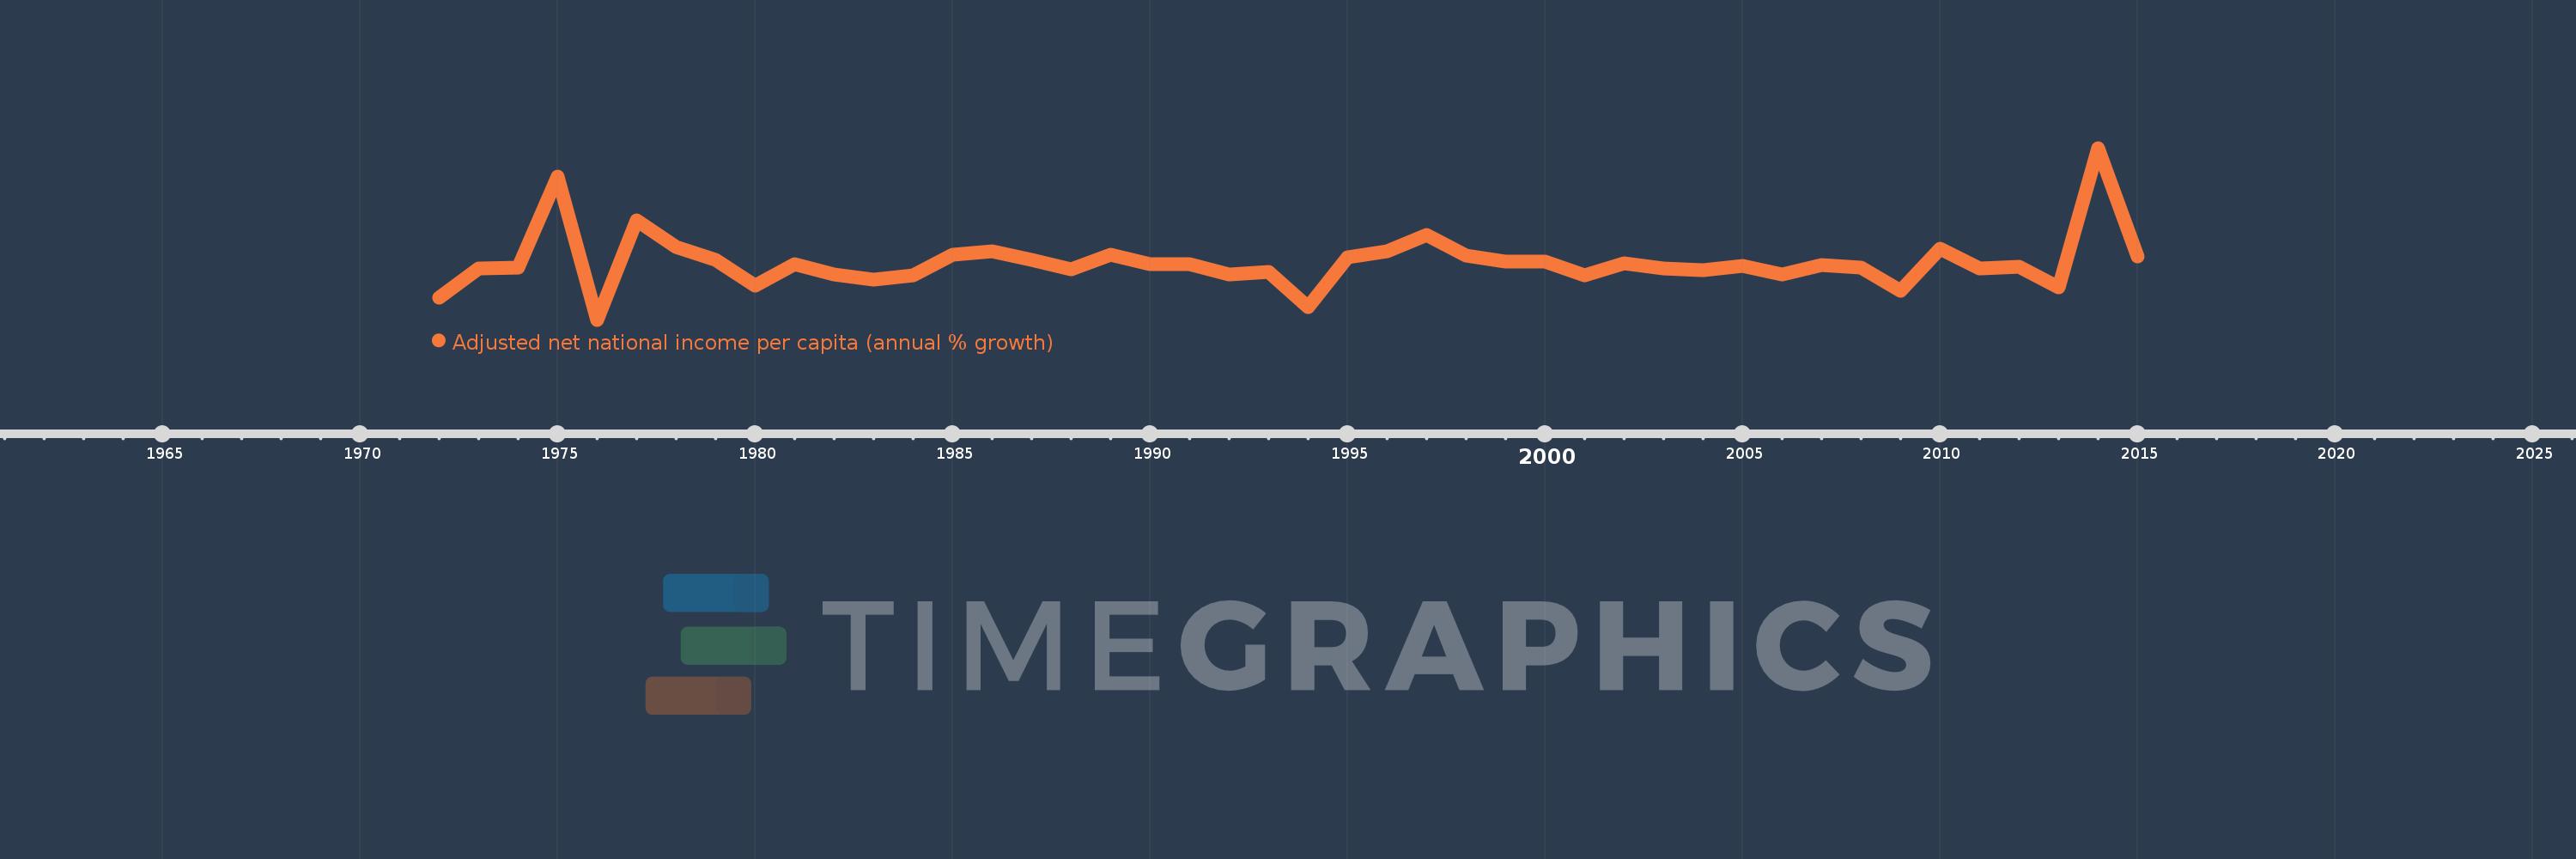
Adjusted net national income per capita (annual % growth)
2015,2014,2013,2012,2011,2010,2009,2008,2007,2006,2005,2004,2003,2002,2001,2000,1999,1998,1997,1996,1995,1994,1993,1992,1991,1990,1989,1988,1987,1986,1985,1984,1983,1982,1981,1980,1979,1978,1977,1976,1975,1974,1973,1972
Cette statistique dans les autres pays:
La ligne de temps
Cette échelle de temps montre un graphique de 1972 année à 2015 année Togo. Les données jusqu'à 1971 année ne sont pas présentés. Quantité d'observations actuelles selon dates: 44.
Source (désignation):
Les indicateurs du développement mondiale
Source (organisation):
World Bank staff estimates based on sources and methods in World Bank's "The Changing Wealth of Nations: Measuring Sustainable Development in the New Millennium" (2011).
Catégories:
Economy & Growth
Dernière mise à jour
23 avr. 2017
Les indicateurs de changement de valeurs selon les années
Minimum:
-39.4
1 janv. 1976
Maximum:
81.571
1 janv. 2014
Pour la date d''observation
Valeur
Changement absolu
Le changement par rapport à la valeur précédente
1 janv. 1972
-23.997
-23.997
0.0%
1 janv. 1973
-3.136
+20.861
-86.93%
1 janv. 1974
-2.81
+0.326
-10.39%
1 janv. 1975
61.505
+64.315
-2.29 milles%
1 janv. 1976
-39.4
-100.905
-164.06%
1 janv. 1977
30.562
+69.962
-177.57%
1 janv. 1978
12.017
-18.545
-60.68%
1 janv. 1979
2.98
-9.037
-75.2%
1 janv. 1980
-15.35
-18.33
-615.07%
1 janv. 1981
0.019
+15.369
-100.12%
1 janv. 1982
-7.678
-7.697
-40.97 milles%
1 janv. 1983
-11.406
-3.728
48.56%
1 janv. 1984
-8.119
+3.287
-28.82%
1 janv. 1985
6.211
+14.331
-176.5%
1 janv. 1986
9.098
+2.887
46.48%
1 janv. 1987
2.488
-6.61
-72.65%
1 janv. 1988
-4.174
-6.662
-267.79%
1 janv. 1989
6.335
+10.509
-251.75%
1 janv. 1990
-0.501
-6.836
-107.91%
1 janv. 1991
-0.414
+0.087
-17.46%
1 janv. 1992
-7.67
-7.257
1.75 milles%
1 janv. 1993
-5.588
+2.082
-27.15%
1 janv. 1994
-30.716
-25.128
449.7%
1 janv. 1995
4.577
+35.293
-114.9%
1 janv. 1996
8.848
+4.272
93.33%
1 janv. 1997
20.232
+11.384
128.65%
1 janv. 1998
5.747
-14.485
-71.59%
1 janv. 1999
1.527
-4.22
-73.43%
1 janv. 2000
1.623
+0.096
6.26%
1 janv. 2001
-7.844
-9.466
-583.38%
1 janv. 2002
0.534
+8.378
-106.81%
1 janv. 2003
-3.311
-3.846
-719.67%
1 janv. 2004
-4.787
-1.476
44.57%
1 janv. 2005
-1.514
+3.273
-68.37%
1 janv. 2006
-7.338
-5.824
384.64%
1 janv. 2007
-0.577
+6.761
-92.14%
1 janv. 2008
-2.468
-1.891
327.71%
1 janv. 2009
-18.74
-16.272
659.29%
1 janv. 2010
10.887
+29.627
-158.1%
1 janv. 2011
-3.184
-14.071
-129.25%
1 janv. 2012
-1.845
+1.339
-42.07%
1 janv. 2013
-16.298
-14.453
783.56%
1 janv. 2014
81.571
+97.869
-600.5%
1 janv. 2015
4.996
-76.576
-93.88%
Classement des pays selon les statistiques actuelles par années


Commentaires: