29
/fr/
fr
AIzaSyAYiBZKx7MnpbEhh9jyipgxe19OcubqV5w
April 1, 2024
156921
Iran, Islamic Rep.
IRN
true
2
1
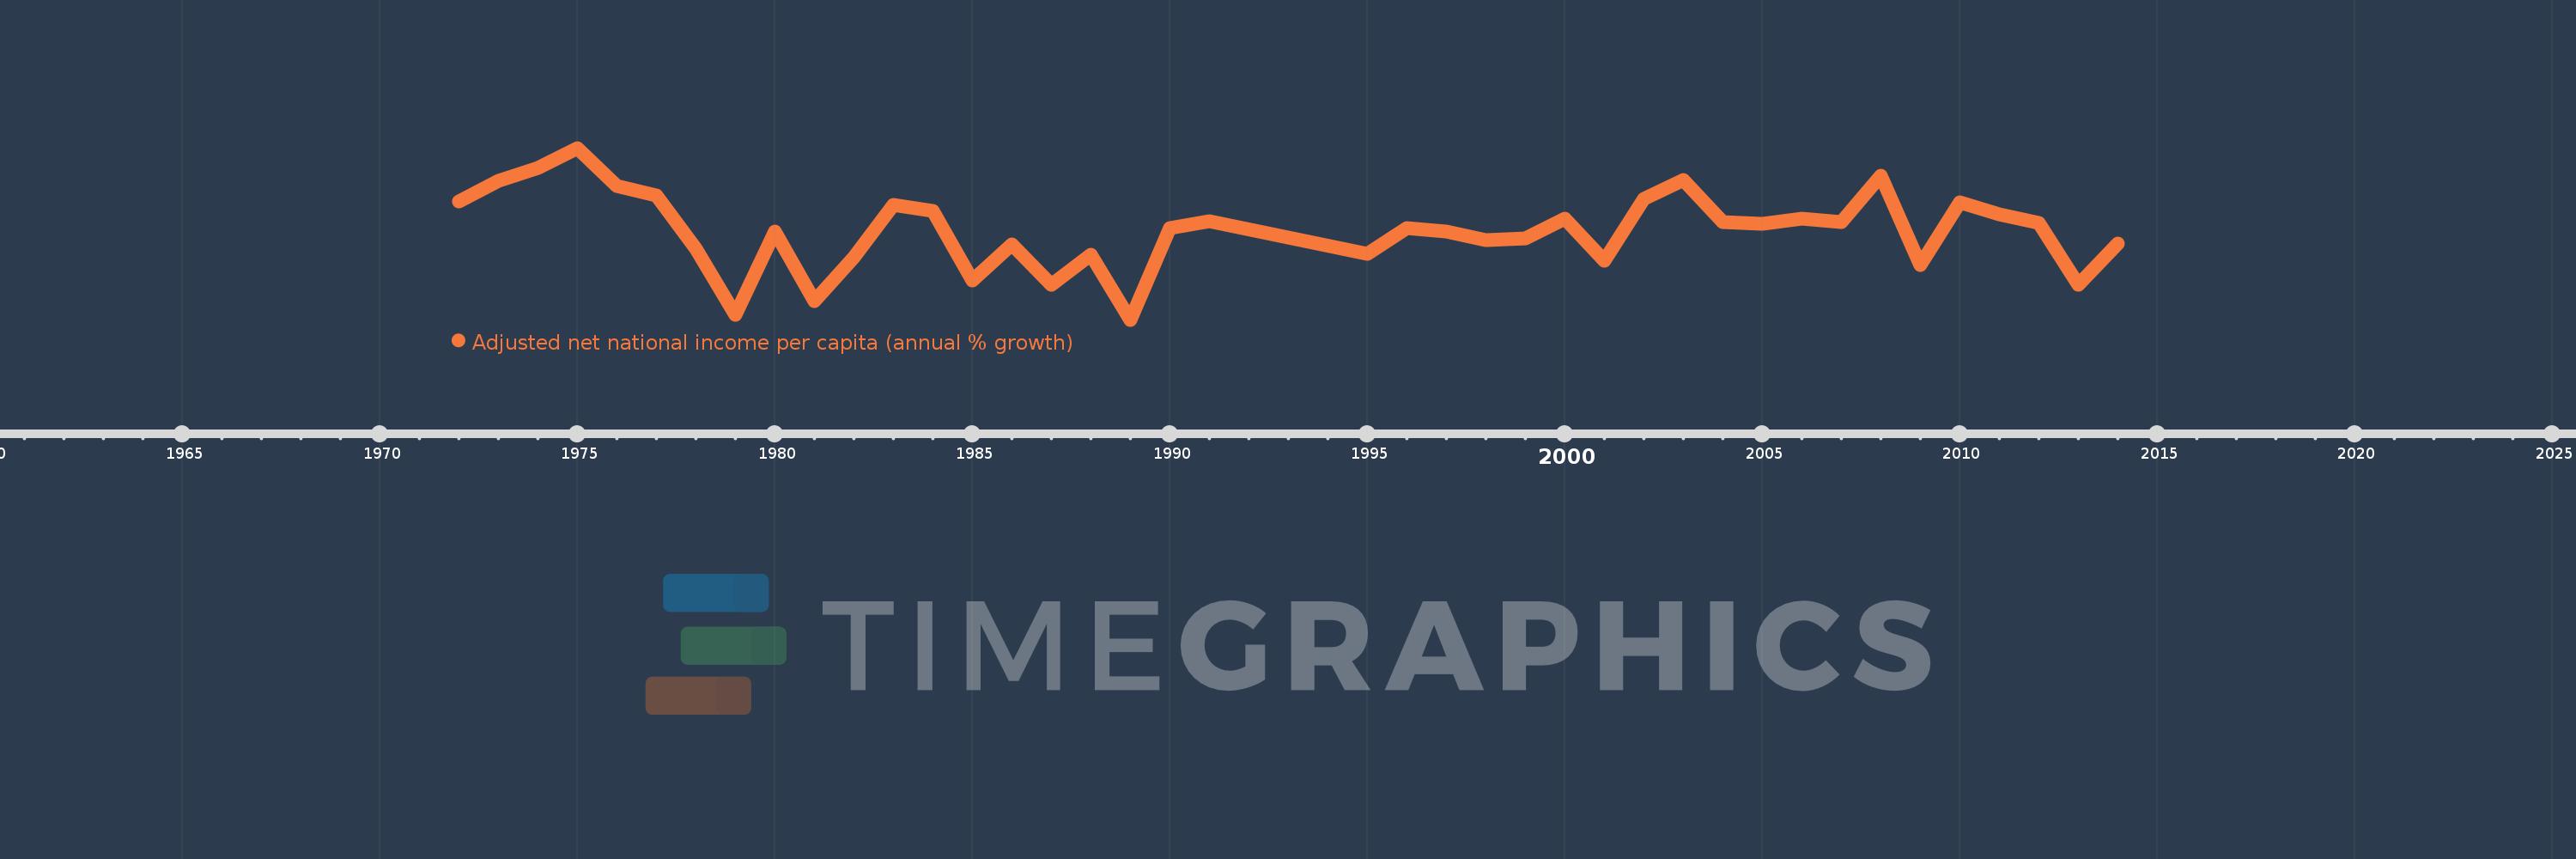
Adjusted net national income per capita (annual % growth)
2014,2013,2012,2011,2010,2009,2008,2007,2006,2005,2004,2003,2002,2001,2000,1999,1998,1997,1996,1995,1991,1990,1989,1988,1987,1986,1985,1984,1983,1982,1981,1980,1979,1978,1977,1976,1975,1974,1973,1972
Cette statistique dans les autres pays:
La ligne de temps
Cette échelle de temps montre un graphique de 1972 année à 2014 année Iran, Islamic Rep.. Les données jusqu'à 1971 année ne sont pas présentés. Quantité d'observations actuelles selon dates: 40.
Source (désignation):
Les indicateurs du développement mondiale
Source (organisation):
World Bank staff estimates based on sources and methods in World Bank's "The Changing Wealth of Nations: Measuring Sustainable Development in the New Millennium" (2011).
Catégories:
Economy & Growth
Dernière mise à jour
23 avr. 2017
Les indicateurs de changement de valeurs selon les années
Minimum:
-22.673
1 janv. 1989
Maximum:
24.701
1 janv. 1975
Pour la date d''observation
Valeur
Changement absolu
Le changement par rapport à la valeur précédente
1 janv. 1972
9.834
+9.834
0.0%
1 janv. 1973
15.635
+5.801
58.98%
1 janv. 1974
19.225
+3.59
22.96%
1 janv. 1975
24.701
+5.476
28.48%
1 janv. 1976
14.203
-10.498
-42.5%
1 janv. 1977
11.587
-2.615
-18.41%
1 janv. 1978
-3.031
-14.618
-126.16%
1 janv. 1979
-21.275
-18.244
601.9%
1 janv. 1980
1.624
+22.899
-107.63%
1 janv. 1981
-17.527
-19.151
-1.18 milles%
1 janv. 1982
-5.355
+12.172
-69.45%
1 janv. 1983
9.035
+14.39
-268.72%
1 janv. 1984
7.378
-1.657
-18.34%
1 janv. 1985
-11.796
-19.173
-259.88%
1 janv. 1986
-1.939
+9.857
-83.56%
1 janv. 1987
-12.937
-10.998
567.25%
1 janv. 1988
-4.85
+8.086
-62.51%
1 janv. 1989
-22.673
-17.823
367.45%
1 janv. 1990
2.641
+25.314
-111.65%
1 janv. 1991
4.425
+1.784
67.57%
1 janv. 1995
-4.467
-8.892
-200.94%
1 janv. 1996
2.667
+7.134
-159.72%
1 janv. 1997
1.749
-0.918
-34.42%
1 janv. 1998
-0.756
-2.506
-143.24%
1 janv. 1999
-0.322
+0.434
-57.44%
1 janv. 2000
5.107
+5.429
-1.69 milles%
1 janv. 2001
-6.329
-11.435
-223.93%
1 janv. 2002
10.568
+16.897
-266.99%
1 janv. 2003
15.897
+5.328
50.42%
1 janv. 2004
4.196
-11.701
-73.6%
1 janv. 2005
3.686
-0.51
-12.14%
1 janv. 2006
5.198
+1.511
41.0%
1 janv. 2007
4.325
-0.873
-16.8%
1 janv. 2008
16.971
+12.646
292.43%
1 janv. 2009
-7.492
-24.463
-144.15%
1 janv. 2010
9.67
+17.162
-229.06%
1 janv. 2011
6.354
-3.315
-34.29%
1 janv. 2012
3.95
-2.404
-37.84%
1 janv. 2013
-12.973
-16.922
-428.45%
1 janv. 2014
-1.655
+11.318
-87.25%
Classement des pays selon les statistiques actuelles par années


Commentaires: