29
/fr/
fr
AIzaSyAYiBZKx7MnpbEhh9jyipgxe19OcubqV5w
April 1, 2024
220393
Paraguay
PRY
true
2
1
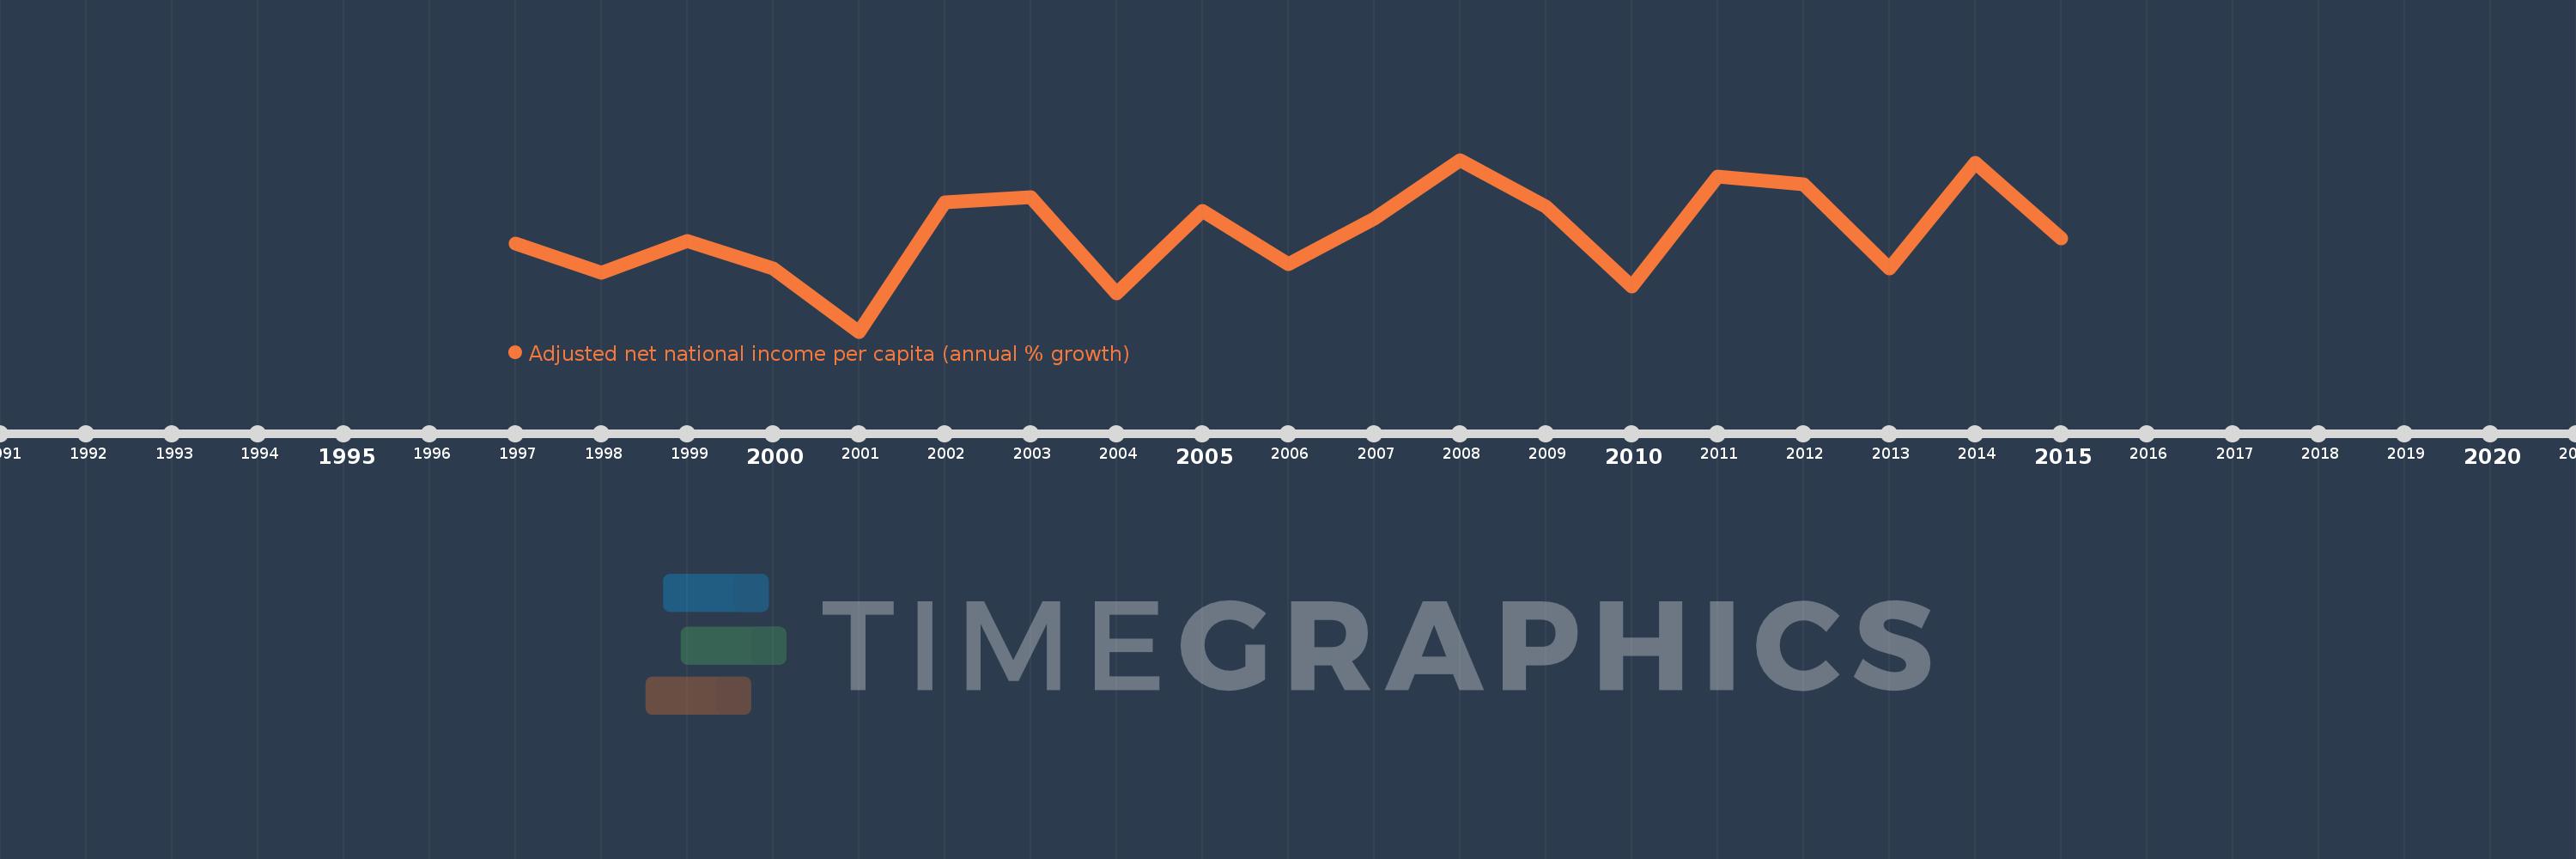
Adjusted net national income per capita (annual % growth)
2015,2014,2013,2012,2011,2010,2009,2008,2007,2006,2005,2004,2003,2002,2001,2000,1999,1998,1997
Cette statistique dans les autres pays:
La ligne de temps
Cette échelle de temps montre un graphique de 1997 année à 2015 année Paraguay. Les données jusqu'à 1996 année ne sont pas présentés. Quantité d'observations actuelles selon dates: 19.
Source (désignation):
Les indicateurs du développement mondiale
Source (organisation):
World Bank staff estimates based on sources and methods in World Bank's "The Changing Wealth of Nations: Measuring Sustainable Development in the New Millennium" (2011).
Catégories:
Economy & Growth
Dernière mise à jour
23 avr. 2017
Les indicateurs de changement de valeurs selon les années
Minimum:
-12.858
1 janv. 2001
Maximum:
12.657
1 janv. 2008
Pour la date d''observation
Valeur
Changement absolu
Le changement par rapport à la valeur précédente
1 janv. 1997
0.282
+0.282
0.0%
1 janv. 1998
-4.128
-4.409
-1.57 milles%
1 janv. 1999
0.601
+4.728
-114.55%
1 janv. 2000
-3.52
-4.121
-686.12%
1 janv. 2001
-12.858
-9.338
265.27%
1 janv. 2002
6.402
+19.26
-149.79%
1 janv. 2003
7.065
+0.663
10.36%
1 janv. 2004
-7.21
-14.275
-202.05%
1 janv. 2005
5.02
+12.23
-169.63%
1 janv. 2006
-2.845
-7.865
-156.66%
1 janv. 2007
3.939
+6.784
-238.48%
1 janv. 2008
12.657
+8.718
221.3%
1 janv. 2009
5.698
-6.959
-54.98%
1 janv. 2010
-6.197
-11.895
-208.76%
1 janv. 2011
10.127
+16.324
-263.4%
1 janv. 2012
9.004
-1.123
-11.09%
1 janv. 2013
-3.486
-12.49
-138.72%
1 janv. 2014
12.188
+15.674
-449.6%
1 janv. 2015
0.995
-11.193
-91.84%
Classement des pays selon les statistiques actuelles par années


Commentaires: